XRP price recovered most losses and rallied toward $2.75. The price is now facing hurdles near the $2.70 zone and might start another decline.
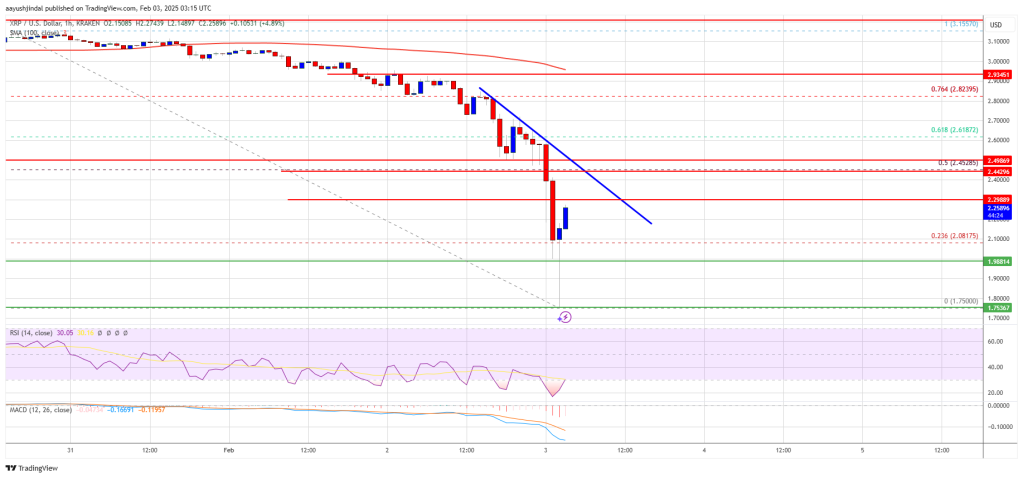
XRP price started a recovery wave from the $1.75 support zone, like Bitcoin and Ethereum. The price gained pace for a move above the $2.00 and $2.25 resistance levels.
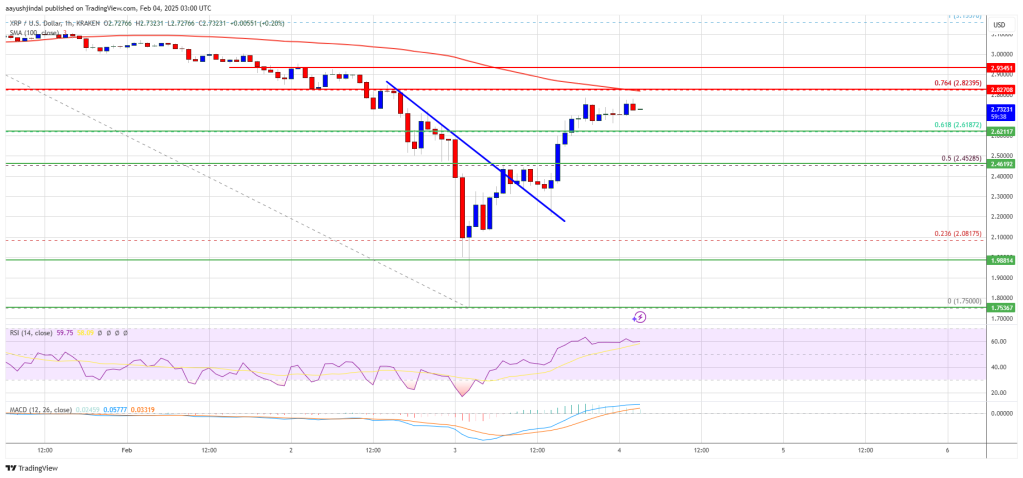
The bulls pumped the price above the $2.50 and $2.550 levels. However, the bears remained active below the $2.80 level. A high was formed at $2.780 and the price is now correcting gains. There was a move below the $2.62 level.
The price dipped below the 23.6% Fib retracement level of the upward move from the $1.750 swing low to the $2.780 high. The price is now trading below $2.70 and the 100-hourly Simple Moving Average.
On the upside, the price might face resistance near the $2.70 level. There is also a new connecting bearish trend line forming with resistance at $2.710 on the hourly chart of the XRP/USD pair. The first major resistance is near the $2.780 level. The next resistance is $2.80.

A clear move above the $2.80 resistance might send the price toward the $2.940 resistance. Any more gains might send the price toward the $3.000 resistance or even $3.050 in the near term. The next major hurdle for the bulls might be $3.120.
If XRP fails to clear the $2.70 resistance zone, it could start another decline. Initial support on the downside is near the $2.420 level. The next major support is near the $2.2650 level or the 50% Fib retracement level of the upward move from the $1.750 swing low to the $2.780 high.
If there is a downside break and a close below the $2.2650 level, the price might continue to decline toward the $2.20 support. The next major support sits near the $2.050 zone.
Technical Indicators
Hourly MACD – The MACD for XRP/USD is now gaining pace in the bearish zone.
Hourly RSI (Relative Strength Index) – The RSI for XRP/USD is now below the 50 level.
Major Support Levels – $2.420 and $2.2650.
Major Resistance Levels – $2.70 and $2.780.
- XRP price started a strong upward move above the $2.60 level.
- The price is now trading below $2.70 and the 100-hourly Simple Moving Average.
- There is a new connecting bearish trend line forming with resistance at $2.710 on the hourly chart of the XRP/USD pair (data source from Kraken).
- The pair might start a fresh increase if it clears the $2.780 resistance zone.
XRP Price Recovery Faces Resistance
XRP price started a recovery wave from the $1.75 support zone, like Bitcoin and Ethereum. The price gained pace for a move above the $2.00 and $2.25 resistance levels.
The bulls pumped the price above the $2.50 and $2.550 levels. However, the bears remained active below the $2.80 level. A high was formed at $2.780 and the price is now correcting gains. There was a move below the $2.62 level.
The price dipped below the 23.6% Fib retracement level of the upward move from the $1.750 swing low to the $2.780 high. The price is now trading below $2.70 and the 100-hourly Simple Moving Average.
On the upside, the price might face resistance near the $2.70 level. There is also a new connecting bearish trend line forming with resistance at $2.710 on the hourly chart of the XRP/USD pair. The first major resistance is near the $2.780 level. The next resistance is $2.80.

A clear move above the $2.80 resistance might send the price toward the $2.940 resistance. Any more gains might send the price toward the $3.000 resistance or even $3.050 in the near term. The next major hurdle for the bulls might be $3.120.
Another Decline?
If XRP fails to clear the $2.70 resistance zone, it could start another decline. Initial support on the downside is near the $2.420 level. The next major support is near the $2.2650 level or the 50% Fib retracement level of the upward move from the $1.750 swing low to the $2.780 high.
If there is a downside break and a close below the $2.2650 level, the price might continue to decline toward the $2.20 support. The next major support sits near the $2.050 zone.
Technical Indicators
Hourly MACD – The MACD for XRP/USD is now gaining pace in the bearish zone.
Hourly RSI (Relative Strength Index) – The RSI for XRP/USD is now below the 50 level.
Major Support Levels – $2.420 and $2.2650.
Major Resistance Levels – $2.70 and $2.780.