Form a New Top If $68K Is Tested?")
- Bitcoin trades at $67K by gaining 1.16% over the last 24 hours.
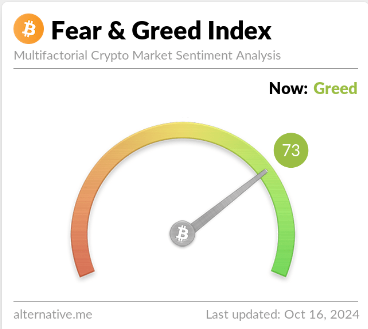
- BTC continued to stay in the greed zone.
The Bitcoin (BTC) price is hovering above $67.5K. If BTC could potentially breakout on the upside, the asset can breach the all-time high (ATH) at $73,750. A failure would pull back the bullish outlook, and Bitcoin might stay below its previous peak.
BTC’s surge to $68K has made bullish predictions, with traders anticipating an increase to surpass its ATH. Analysts expect a further upward movement in the second half of October.
An analyst mentions the “bull market summer chop,” which refers to a period where BTC price fluctuates within a narrow range during the summer months before a significant upward movement. Historically, this often led to price breakouts occurring between October 20th and 30th.
However, the asset’s price had a modest 1.16% increase over the past 24 hours. Bitcoin has touched the peak of $68,334, and its low is found at $66,647. At press time, BTC traded at $67,727 with its daily trading volume surging over 6% to $35 billion, as per CMC data. Consequently, BTC has stepped into the greed zone as the Fear and Greed Index stays at 73.
Analyzing the BTC Technical Indicators
Zooming in at the four-hour technical chart of BTC, the Moving Average Convergence Divergence (MACD) indicator is positioned below the signal line, highlighting the bearish sentiment in the market, and traders can expect the incoming bear run.
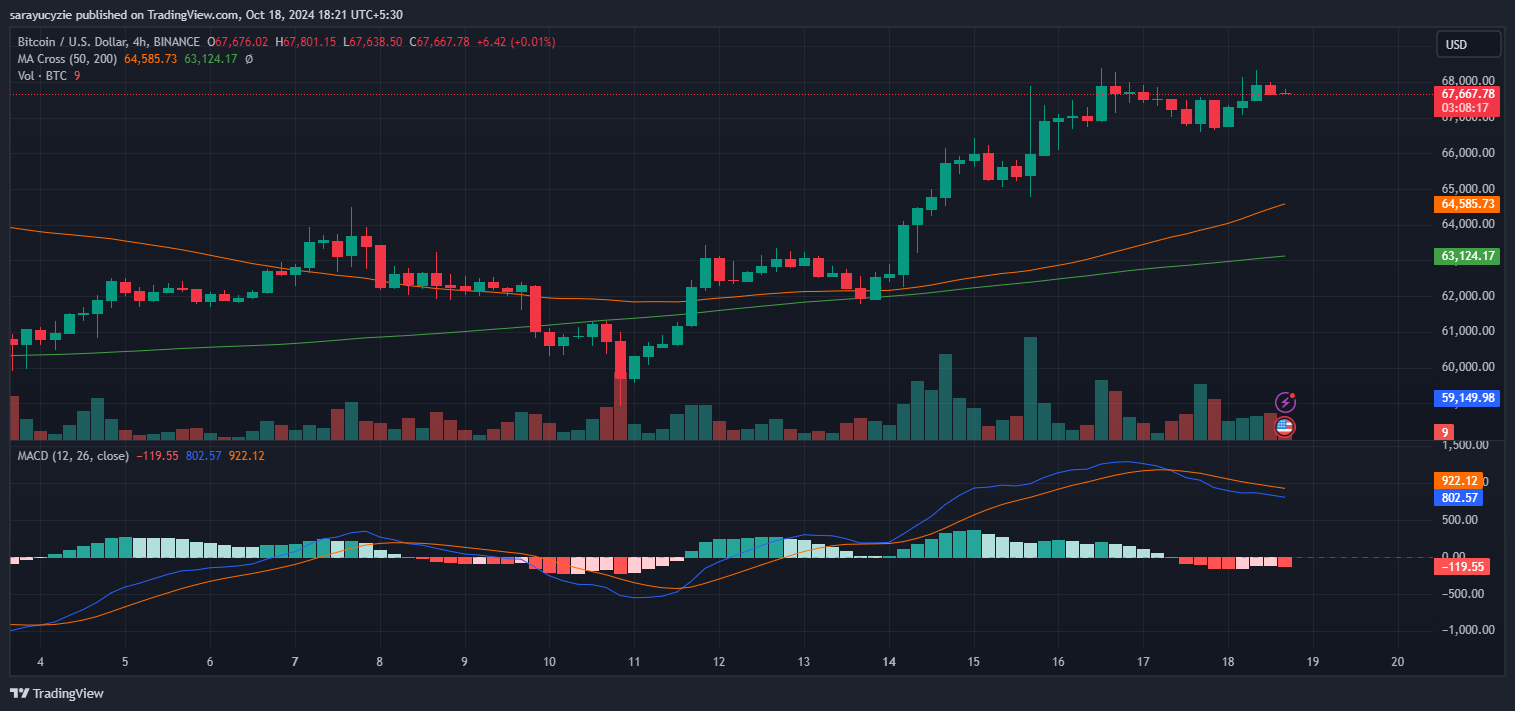
Besides, the daily relative strength index (RSI) of Bitcoin is standing at 62.49, showing a neutral market sentiment. In addition, the daily frame of BTC reveals the short-term 50-day moving average above the long-term 200-day moving average at $64,585 and $63,124, respectively.
On the other hand, BTC’s current price momentum fluctuates between $66K and $68K. Breaking past the $68.5K mark might trigger a bull cycle. Further, the asset may test the potential resistance at the crucial zone for the bulls at $68,879. In defiance, if the asset fails to hold up its price and falls back to the $66K mark, it might provoke BTC to push the price to a low of $65,900.