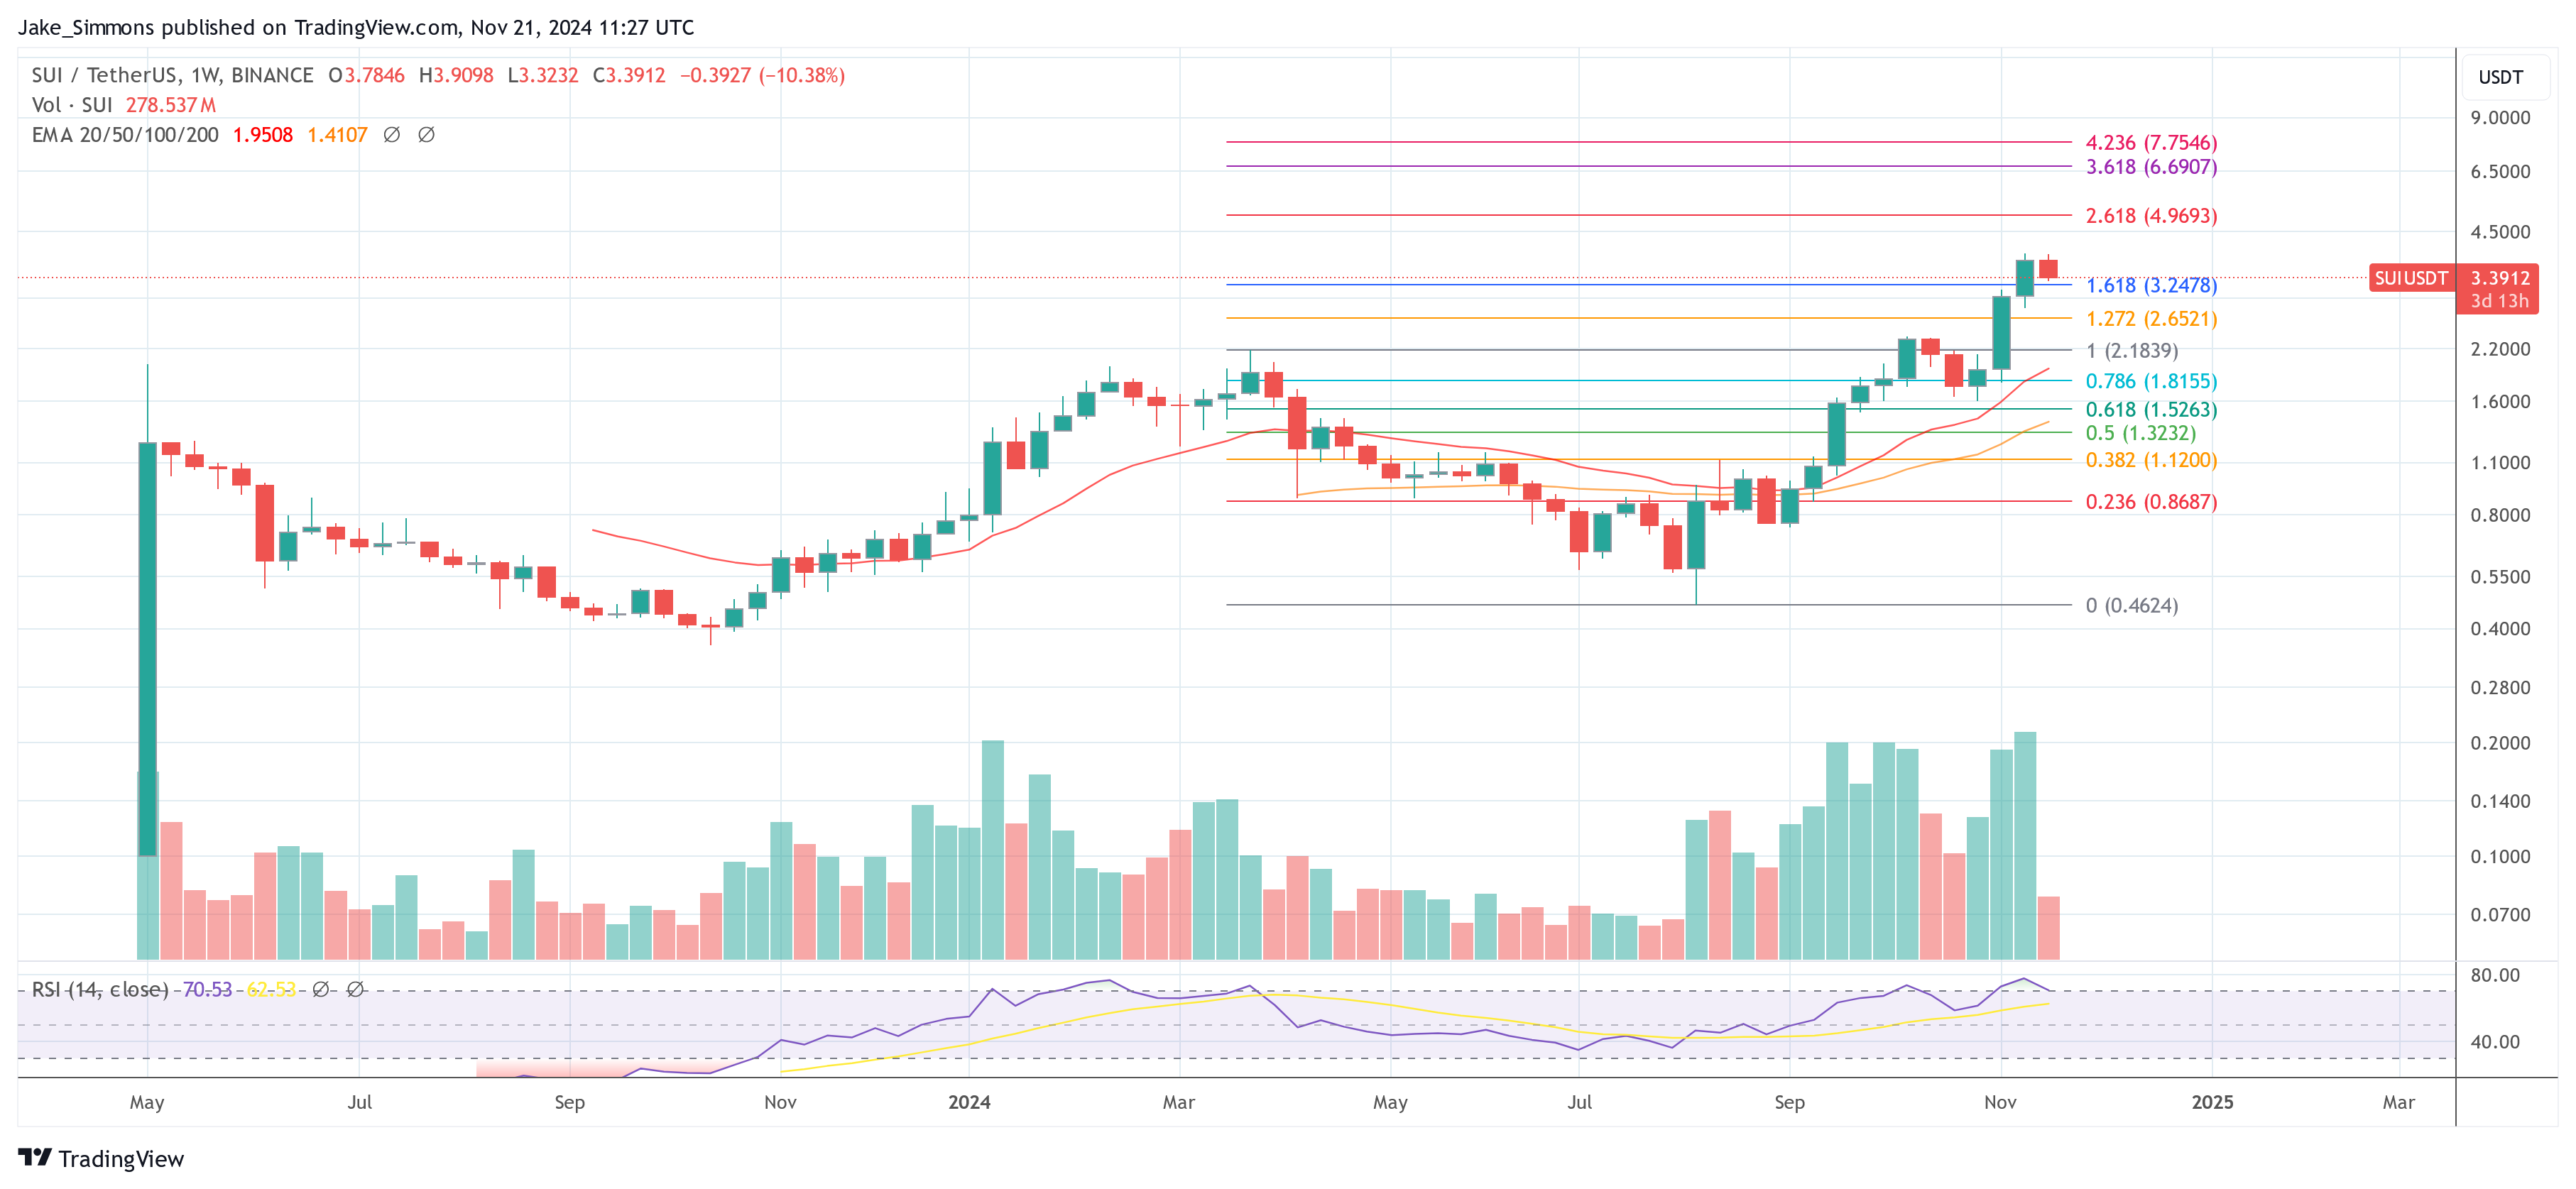
Despite market fluctuations, SUI has demonstrated remarkable stability, holding steady above the critical $3.5 support level. This steady performance reflects underlying bullish momentum, as buyers continue to defend this key zone, boosting confidence in the asset’s upward potential. With strong support intact, SUI appears well-positioned to target higher resistance levels, sparking optimism for further gains.
This analysis aims to explore SUI’s ability to stay above the $3.5 level and assess its implications for future price movements. By examining key technical indicators and resistance zones, this piece seeks to provide insights into whether SUI can sustain its bullish strength or if market pressures could trigger a shift in its trajectory.
SUI is showcasing renewed bullish strength as it maintains a firm position above the critical $3.5 support level. This stability highlights growing buying interest and market confidence, paving the way for a possible move toward the $4 mark. Its ability to hold above this key level and the 4-hour Simple Moving Average (SMA) reinforces the asset’s upward momentum, and positions SUI for further gains if positive sentiment persists.
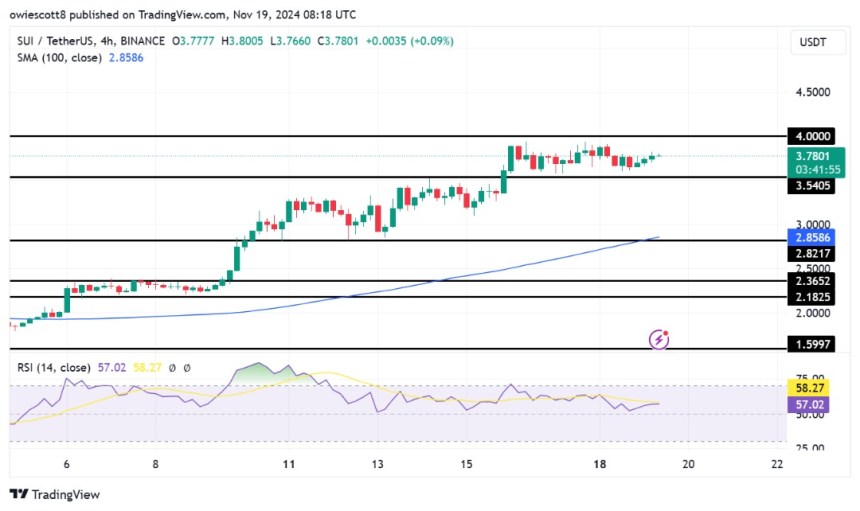
An analysis of the 4-hour Relative Strength Index (RSI) analysis shows a rebound from 51%, rising toward and above the 60% level, indicating a renewed optimistic outlook. If the RSI continues to rise above 60%, it would confirm the positive trend, boosting the potential for more price growth.
Additionally, SUI shows significant upward movement on the daily chart, marked by the formation of a bullish candlestick as it moves toward the $4 mark. Trading above the crucial 100-day SMA reinforces the positive trend, indicating sustained strength. As SUI continues to climb, it bolsters market confidence, setting the stage for growth. With upside pressure brewing, the next key target to watch out for is the $4 resistance level, which could determine whether the bullish move extends.
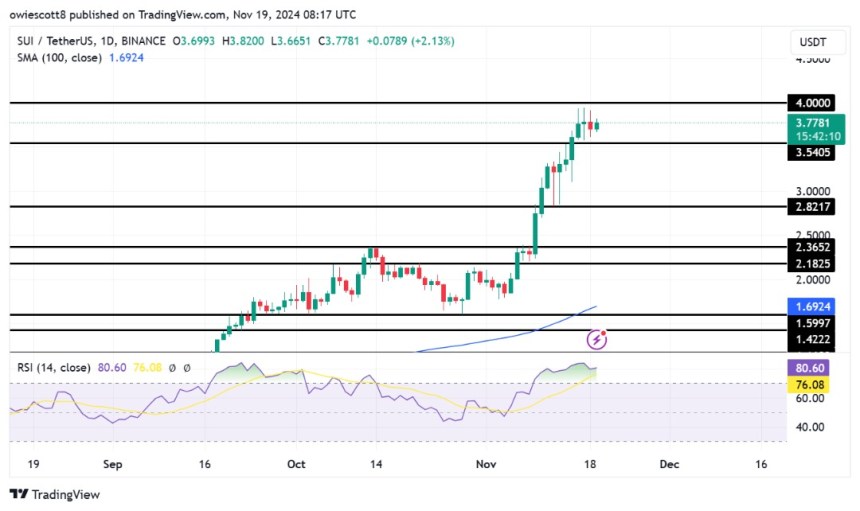
The daily chart’s RSI has increased to 80%, signaling strong positive sentiment with sustained buying pressure. While the asset remains in an overbought territory, it shows no signs of weakening. If the momentum continues, further price gains are possible, though one should be cautious, as prolonged overbought conditions could lead to a correction if buying pressure decreases.
SUI’s current stability above the $3.5 support level indicates potential for continued upside. Should buying pressure persist, the next key target lies at $4, where bullish interest could be triggered, leading to new price highs.
However, if resistance at $4 proves challenging to break through, consolidation or a minor decline may occur, possibly causing the price to retreat toward the $3.5 support level. A break below this level could result in additional losses, with the next key support target being around $2.8, followed by other support areas below.

This analysis aims to explore SUI’s ability to stay above the $3.5 level and assess its implications for future price movements. By examining key technical indicators and resistance zones, this piece seeks to provide insights into whether SUI can sustain its bullish strength or if market pressures could trigger a shift in its trajectory.
What SUI Stability Above $3.5 Means For Bulls
SUI is showcasing renewed bullish strength as it maintains a firm position above the critical $3.5 support level. This stability highlights growing buying interest and market confidence, paving the way for a possible move toward the $4 mark. Its ability to hold above this key level and the 4-hour Simple Moving Average (SMA) reinforces the asset’s upward momentum, and positions SUI for further gains if positive sentiment persists.

An analysis of the 4-hour Relative Strength Index (RSI) analysis shows a rebound from 51%, rising toward and above the 60% level, indicating a renewed optimistic outlook. If the RSI continues to rise above 60%, it would confirm the positive trend, boosting the potential for more price growth.
Additionally, SUI shows significant upward movement on the daily chart, marked by the formation of a bullish candlestick as it moves toward the $4 mark. Trading above the crucial 100-day SMA reinforces the positive trend, indicating sustained strength. As SUI continues to climb, it bolsters market confidence, setting the stage for growth. With upside pressure brewing, the next key target to watch out for is the $4 resistance level, which could determine whether the bullish move extends.

The daily chart’s RSI has increased to 80%, signaling strong positive sentiment with sustained buying pressure. While the asset remains in an overbought territory, it shows no signs of weakening. If the momentum continues, further price gains are possible, though one should be cautious, as prolonged overbought conditions could lead to a correction if buying pressure decreases.
Potential Scenarios: Upside Targets And Risks To Watch
SUI’s current stability above the $3.5 support level indicates potential for continued upside. Should buying pressure persist, the next key target lies at $4, where bullish interest could be triggered, leading to new price highs.
However, if resistance at $4 proves challenging to break through, consolidation or a minor decline may occur, possibly causing the price to retreat toward the $3.5 support level. A break below this level could result in additional losses, with the next key support target being around $2.8, followed by other support areas below.


