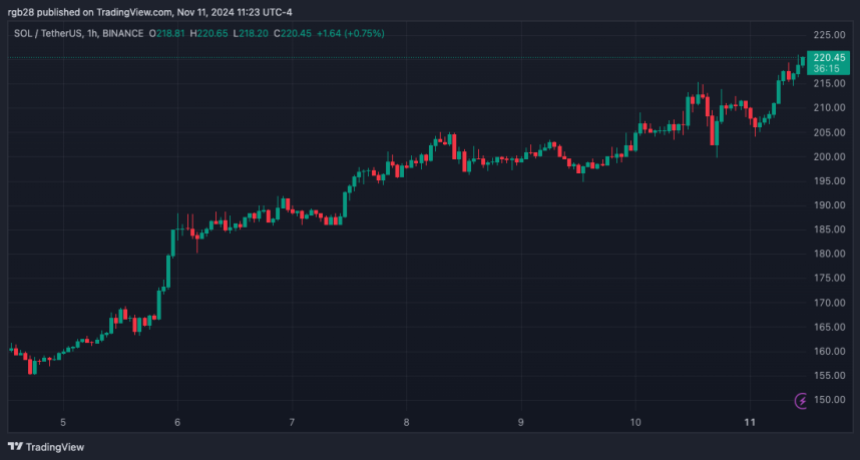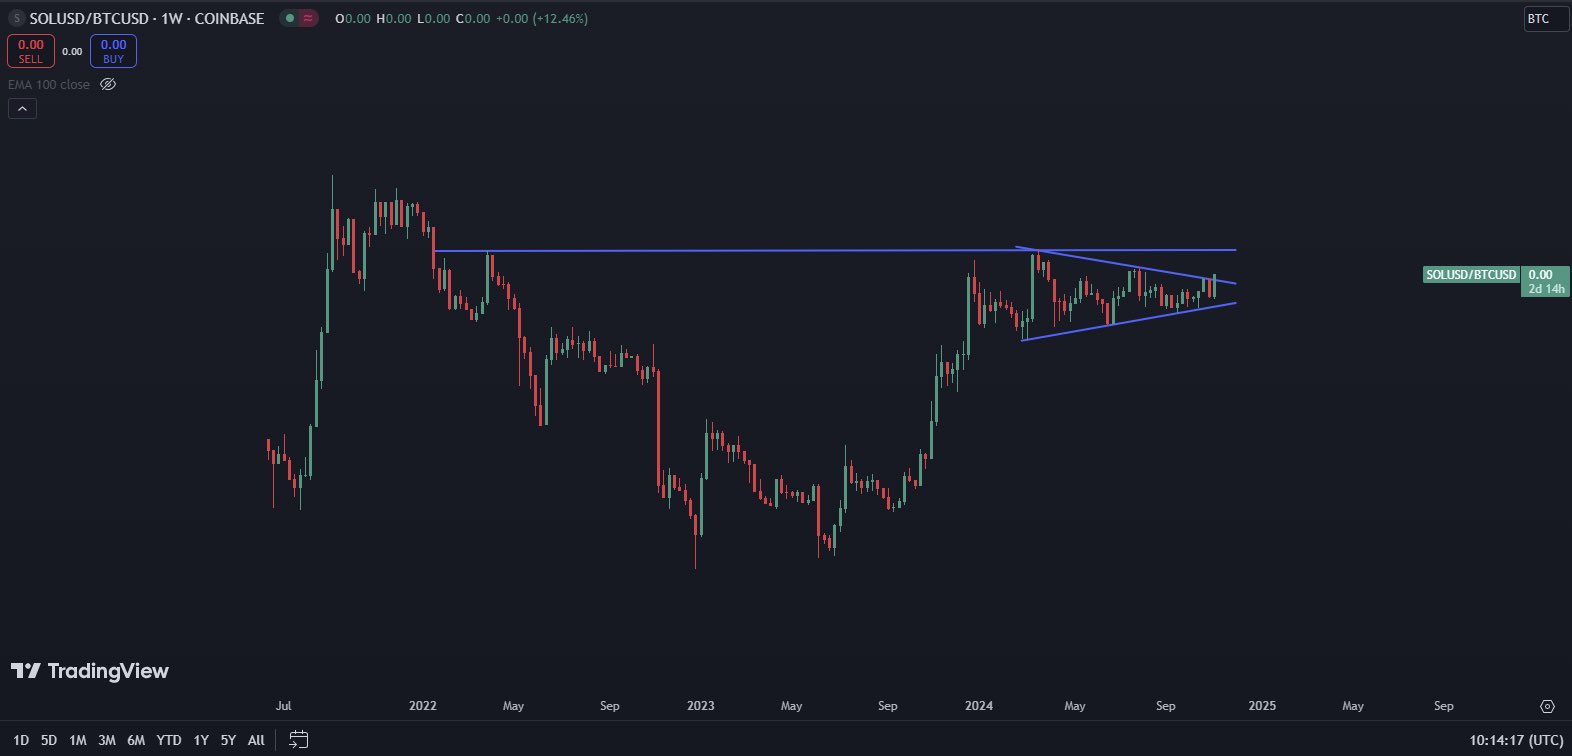
- SOL reaches $196, marking highest level since July
- Technical indicators show strong momentum with RSI at 66.87
- Price targets $210.03 year-to-date high with key resistance at $193.34
Recent political developments in the United States have triggered significant movement in cryptocurrency markets, particularly affecting Solana’s price trajectory.
The digital asset currently demonstrates strong technical positioning as it approaches critical resistance levels.
Solana technical analysis and market dynamics
Trading activity shows SOL maintaining position above its 20-day exponential moving average, traditionally interpreted as a bullish market signal.
This technical formation suggests sustained buying pressure and potential for continued upward momentum as traders respond to broader market catalysts.
The Relative Strength Index provides additional confirmation of market strength, registering 66.87 on the scale.
This reading indicates robust momentum without entering overbought territory, potentially leaving room for further price appreciation before technical warnings emerge.

Source: TradingView
Market participants now focus on the crucial $193.34 resistance level, representing the final significant hurdle before SOL can challenge its year-to-date peak of $210.03. Sustained trading volume and continued buying pressure appear necessary for breaking through these key price points.
However, market observers note potential risks to this bullish scenario. Any significant decline in buying momentum or increase in profit-taking activity could trigger a retracement below $186.40, with further support levels established around $171.78.
The convergence of political developments and technical strength creates an intriguing market dynamic for Solana’s short-term prospects. Trading patterns suggest maintained bullish sentiment while approaching critical price levels that may determine near-term direction.


