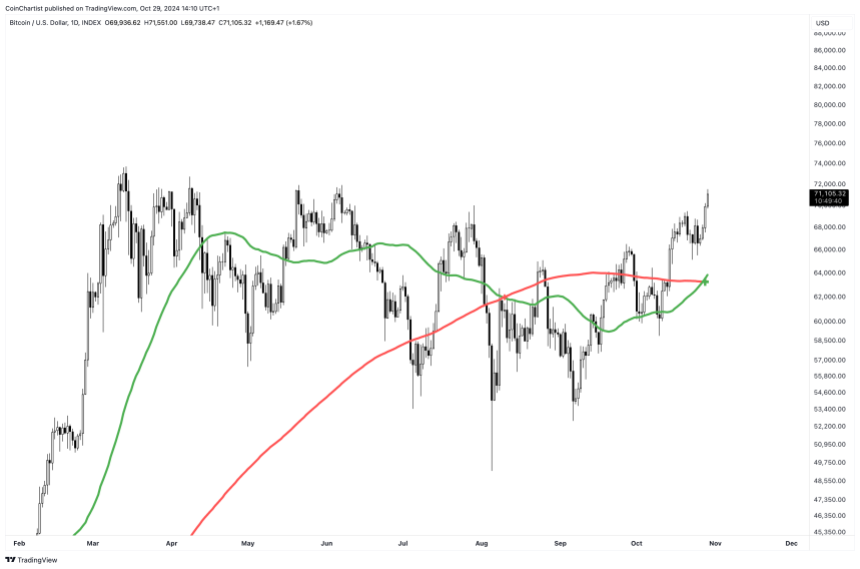
- SOL’s 50-day SMA approaching golden cross with 200-day SMA.
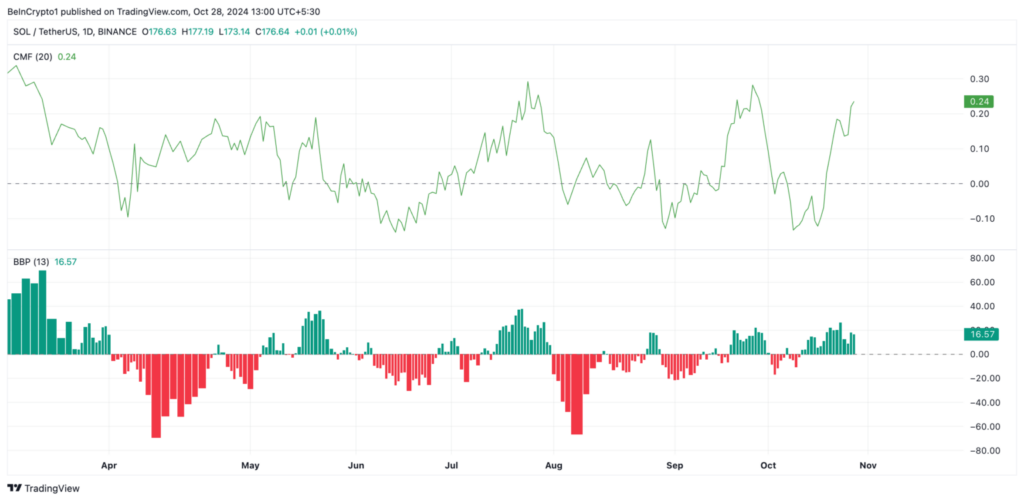
- Chaikin Money Flow at 0.24 and Bull Bear Power at 16.57 support bullish outlook.
- Price targets: potential surge to $210.18 if $188.74 resistance breaks.
Solana (SOL) stands on the cusp of a significant technical development as its 50-day Simple Moving Average approaches a golden cross with the 200-day SMA. This imminent bullish signal could potentially catalyze a push beyond the $200 mark, a level unseen for several months.
Technical analysis of the SOL/USD daily chart reveals the 50-day SMA (blue line) verging on a crossover above the 200-day SMA (yellow line). The 50-day SMA, serving as a short-term trend indicator, provides insight into recent price momentum, while the 200-day SMA reflects longer-term market sentiment.
Their impending intersection signals a potential shift from bearish to bullish market dynamics.
Solana’s CMF maintains positive outlook
Supporting this bullish setup, Solana’s Chaikin Money Flow (CMF) maintains a positive trajectory at 0.24. This reading suggests strong capital inflows into the SOL market, with buying pressure consistently outpacing selling activity.
The sustained positive CMF indicates robust demand and validates the current upward price momentum.
Further reinforcing the optimistic outlook, Solana’s Bull Bear Power indicator registers a robust 16.57. This positive reading reflects a market dominated by buying pressure, suggesting that bulls currently maintain control over price action. The confluence of these technical indicators strengthens the case for potential upward movement.

Source: TradingView
Currently trading at $174, Solana maintains position above crucial support at $171.91. A continued hold above this level could facilitate a push toward the $188.74 resistance. Breaking this barrier could potentially propel SOL towards $210.18, a price point last visited on March 18.
A failure to maintain the $171.91 support could trigger a retreat to $160.09, with further weakness potentially testing the $148.27 level.


