- SHIB burn rate surged 3348%, fueling long-term price optimism.
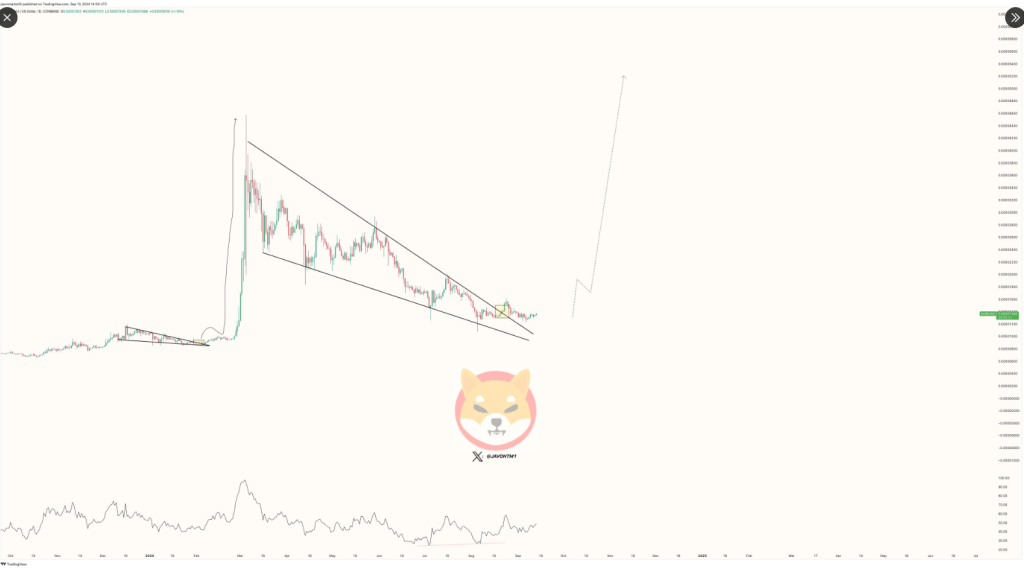
- Symmetrical triangle pattern suggests potential breakout or further consolidation.
Shiba Inu (SHIB), the second largest memecoin by marketcap, has captured market attention with its recent price movements and a dramatic increase in its burn rate. Amid hitting two week high of $0.00001411, four days ago, SHIB bears took back control today, it is trading at $0.00001328 with a decline of 0.97% in the past 24 hours and 2% in a week.
Despite the recent dip, SHIB’s technical patterns suggest potential for an upcoming breakout. The symmetrical triangle pattern formed during the consolidation phase has signaled both opportunities and risks for traders. Analysts suggest that, the price action, coupled with a tightening triangle pattern, suggests an impending move, with traders closely watching for either a breakout or further consolidation.
Meanwhile, adding to it, SHIB’s burn rate saw an unprecedented 3348% surge on September 17, with 7.8 million coins destroyed in the last 24 hours alone, according to data from Shibburn. Over the past week, 39.37 million SHIB tokens were removed from circulation, fueling speculation of a potential price surge, driven by the law of supply and demand.
In addition, whale accumulation of SHIB has increased by 3.39% in the past 30 days, showing renewed confidence among large holders. Recent ecosystem upgrades, including developments on Puppynet and Bor, have further bolstered investor sentiment.
Will SHIB Bulls Give A Comeback?
While SHIB’s futures market remains bullish, with significant open interest at key price levels, market experts caution that the token’s path to $0.001 may take time. Nonetheless, the growing burn rate and continued ecosystem expansion present strong indicators for SHIB’s long-term prospects.
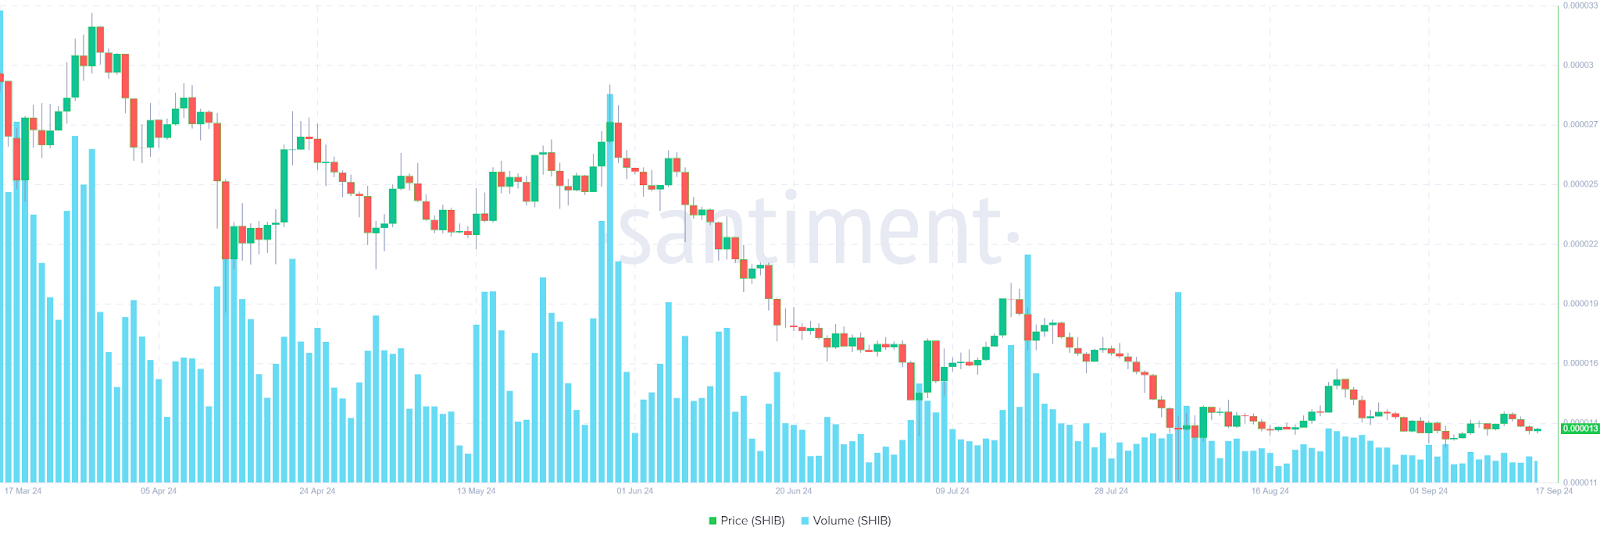
SHIB Price Chart, Source: Sanbase
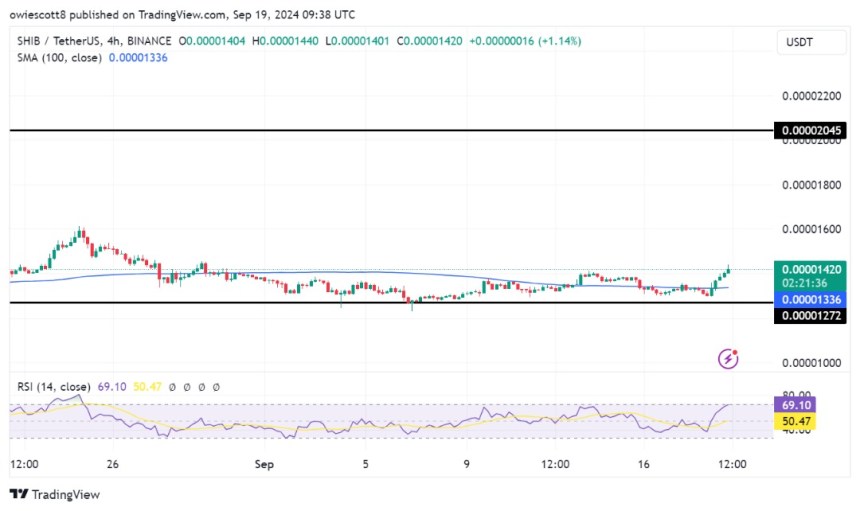
The daily chart shows SHIB entrenched in a bearish trend, with the 9-day Exponential Moving Average at $0.00001341. The daily Relative Strength Index (RSI) stands at 45, indicating nearing oversold condition.
If bullish momentum sustains, the next resistance levels are $0.00001419 and $0.00001603. However, continued bearish sentiment could lead to a drop to $0.00001293, with potential support at $0.00001186.
Highlighted News Of The Day
Can Ethereum (ETH) Retain Its Bullish Momentum?