- Quant (QNT) rose over 17% in the past week, reaching its highest point since August 24.
- Quant’s futures open interest has surged to $13.91 million, its highest level since June 7.
The interoperability network crypto coin Quant (QNT) has showcased a notable price increase of approximately 12%, climbing from a low of $63.96 to a high of $71.58. This marks the second consecutive day of gains, with QNT reaching its highest level since August 24. Although the token has risen by over 17% from its lowest point last week, it remains 47.87% below its highest value this year.
However, the current QNT price movement comes in aside from the global crypto market, where major assets like Bitcoin (BTC) and Ethereum (ETH) have declined steeply. Bitcoin has dropped to the $54,000 zone, while Ethereum has fallen to the $2,200 range.
In addition to the Quant market trend, on-chain data reveals a notable shift. According to Santiment, there’s been a rise in address activity, with a positive divergence between QNT price and Daily Active Addresses (DAA). This divergence suggests that higher accumulation often leads to price rebounds.
Analysts note that top addresses, or whales, have begun accumulating Quant near these lower levels, indicating Quant future potential gains. Further, QNT’s futures open interest has also surged, reaching a high of $13.91 million, the highest level since June 7. This marks a substantial increase from last week’s low of $6.50 million, indicating growing investor interest.
QNT Coin Analysis—24 Hours
Earlier, QNT price movement was in a correction phase for the past few months, but this trend might be reversing as the price starts to recover. At the time of writing, Quant is priced at $70.9 with a market cap of $850 million. Additionally, the daily trading volume of QNT climbs over 290% to $38 million.
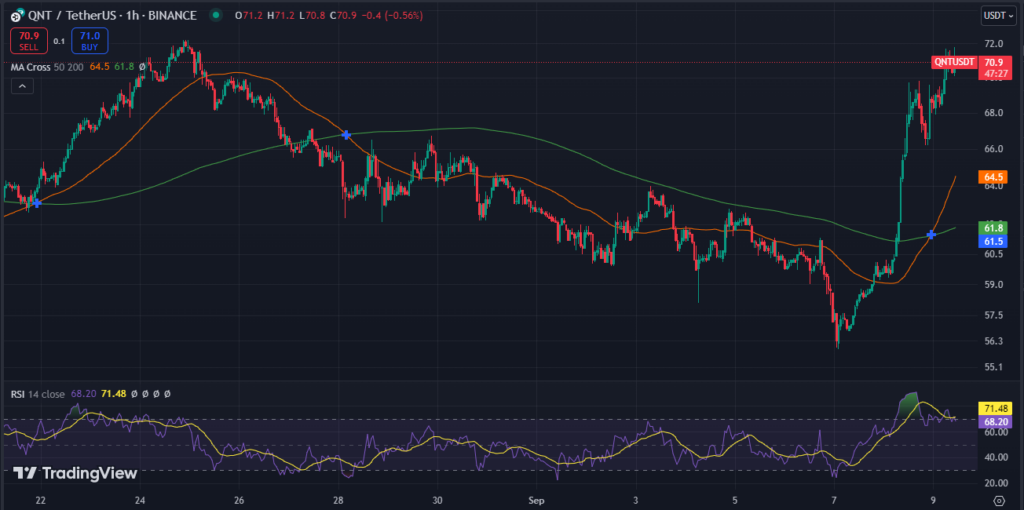
QNT Price Movement (Source: TradingView)
The primary resistance level is now around $71.58. If QNT can break through this level, it might continue its bullish trajectory. On the support side, the recent low of $55.9 serves as a critical level. A drop below this could signal a reversal or consolidation phase.
According to the QNT coin analysis, the 50-day MA crossing above the 200-day MA (a “golden cross”) would typically indicate a strong bullish trend. Conversely, if the shorter moving average falls below the longer one, it might suggest a bearish sentiment.
Looking ahead, the RSI and MACD are essential for understanding momentum. An RSI approaching overbought territory could indicate that QNT might face a short-term pullback. The MACD line crossing above the signal line would confirm bullish momentum.
The overall Quant market trend remains positive, as the improvement in on-chain metrics and increased accumulation by major addresses suggest a promising outlook for Quant.
Highlighted News Of The Day
Why Did a MultiSig Wallet Liquidate 3.8K ETH From Vitalik?