- Solana has exhibited a price increase of 4.58% in the last 24 hours.
- The altcoin’s daily trading volume has dipped by 25.46% reflecting leading cryptocurrencies.
With the coming of the AltSeason, several cryptocurrencies have shown price breakouts. Trading charts show new highs and price levels entering new ranges that were previously unvisited. This bullish market has rewarded the prolonged patience that the community held over the past months.
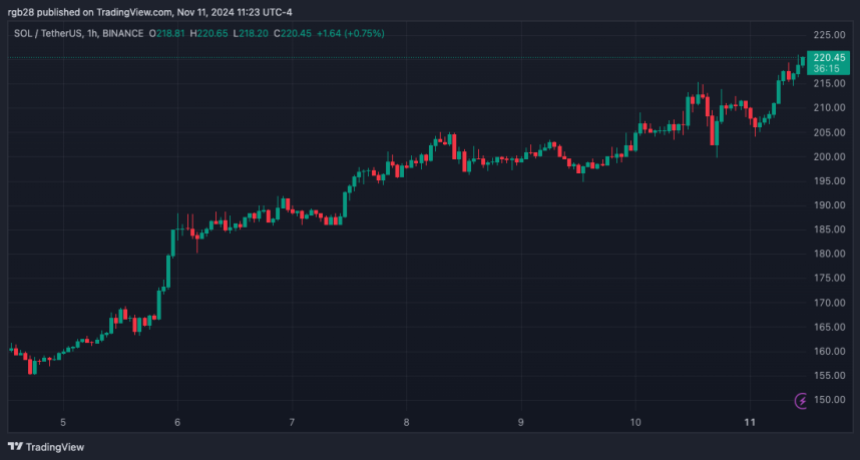
Speaking of altcoins, the second largest ecosystem’s native token, Solana has resumed its bullish trend. The cryptocurrency has shown struggles to break resistance at the $220 level, having tested it several times over the past week. This recent price cycle has seen the token take another chance to hit $220.
Inferring its daily price chart, 24 hours ago, Solana was trading at $209.54 after which it proceeded to fall further to an intra-day low of $204.48. However, following this, the altcoin sparked bullish candles and rallied to current trading levels. At the time of writing, Solana was trading at $219.49 as per CMC data.
Meanwhile, Solana-based memecoins have shown increased activity over the past week. Tokens such as dogwifhat, BONK, and Popcat have surged in price in the last 24 hours as well. However, it is Peanut the Squirrel (PNUT) that stole the show this month with significant price increases.
Will Solana Price Rally to $300?
When analyzing Solana’s price movements in the past two months, the altcoin shows an ascending triangle pattern followed by a price breakout. This pattern is stated to be a characteristic of an ongoing bullish trend. The price breakout suggests that the price movement has coincided with market analysts’ predictions.
SOL/USDT Daily Price Chart (Source: TradingView)
Additionally, Solana’s Moving Average Convergence Divergence (MACD) shows the signal line standing above the MACD line. This indicates a positive trend in the market highlighting SOL’s possibility to break current resistance at $220.
The altcoin, as aforementioned, has tested $220 nearly five times in the past week before receding downwards. Moreover, the cryptocurrency’s RSI stands close to an overbought situation at 69.77 as per TradingView data. This further elucidates the positive market sentiment among investors.
Highlighted Crypto News Today:
Ethereum (ETH) Faces Critical Test at $3K Support Level


