- Galaxy Digital sold 10.85M ENA at $1.144, securing a $2.37M profit.
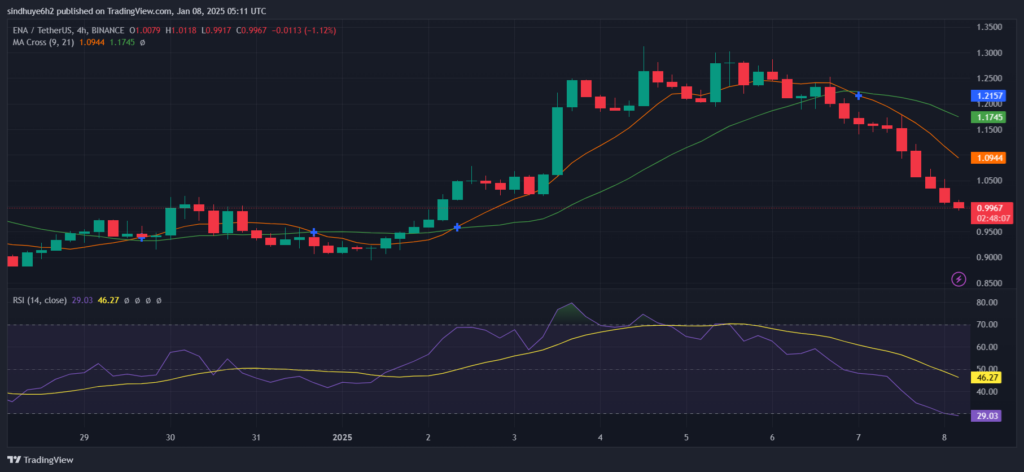
- RSI at 46.27 shows neutral momentum, but MACD signals bearish trends.
Galaxy Digital deposited 4.46 million ENA ($4.92 million) to Binance nine hours ago, continuing a major selloff. Over the last 29 hours, they offloaded 10.85 million ENA ($12.4 million) at an average price of $1.144, generating a $2.37 million profit. In total, three whales, including Galaxy Digital, have transferred 25.81 million ENA ($30.43 million) to Binance and Bybit over the past two days.
ENA’s price has dropped significantly, trading at $0.9951. The market cap is $3.01 billion, reflecting a 13.71% decline in the past day. Trading volume surged 30.44% in the last 24 hours, hitting $613.15 million, with a volume-to-market cap ratio of 20.12%. ENA has a total value locked (TVL) of $5.89 billion, giving it a market cap-to-TVL ratio of 0.5162.
Will ENA Plunge Further?
On the technical front, ENA faces resistance at $1.09 and $1.21. Immediate support lies at $0.99, with potential downside risks toward $0.95 if breached. The 4-hour chart indicates a bearish trend, as the 9-day moving average has crossed below the 21-day moving average. This crossover suggests continued downward pressure on the price.
The Relative Strength Index (RSI) is currently at 46.27, signalling a neutral market. However, a recent dip to 29 suggests the token was briefly oversold, which could attract buyers. The RSI’s downward trend, coupled with a declining moving average, points to weakening momentum.

The Bollinger Bands on the chart have widened, reflecting increased volatility in recent trading sessions. The price has moved below the middle band, confirming the bearish sentiment. If ENA fails to reclaim its $1.09 resistance, a move toward the lower Bollinger Band near $0.95 is likely.
In addition, the Moving Average Convergence Divergence (MACD) indicator shows bearish momentum, with the MACD line trending below the signal line. The histogram reflects growing negative divergence, reinforcing the selling pressure.
ENA maintains active trading with a circulating supply of 3.03 billion tokens and a total supply of 15 billion. However, breaking below key support levels could trigger further losses. Conversely, a successful retest of the $1.09 resistance may indicate a reversal.
Highlighted Crypto News Today
Pierre Poilievre Could Be Canada’s Next Pro-Crypto Prime Minister


