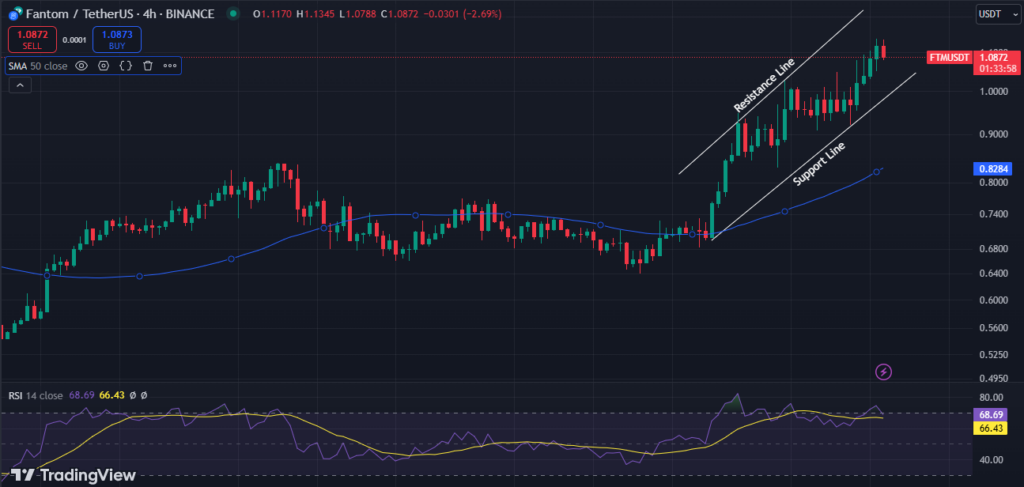
- Fantom (FTM) has broken its prolonged bearish trend with a 60% surge in weekly price.
- Over the past 24 hours, FTM climbed from $0.9282 to a high of $1.13, a level not seen since March.
While the global crypto market is stumbling due to Bitcoin’s sudden plunge to the $91K zone, Fantom (FTM) has emerged as the top gainer, surging to a 9-month high. Over the past 24 hours, FTM has climbed 21.74%, rising from a low of $0.9282 to an intraday peak of $1.13—a level last seen in March.
At the time of writing, the altcoin is trading at $1.08 with a market capitalization of $3.06 billion, while its daily trading volume has jumped by 68%, reaching $1.38 billion.
Fantom has been largely muted over the past two weeks when the crypto market showed an extremely bullish trend. However, Fantom has managed to break through its prolonged bearish trend and is now sitting well above the crucial $1.05 resistance.

Fantom Open Interest (Source: Coinglass)
The surge in Fantom’s price has been triggered by a significant rise in open interest, which has increased by 18% to $408 million—a level last observed during the March bull run. According to data from Coinglass, the FTM open interest-weighted funding rate indicates a bullish market sentiment, with long position holders paying short position holders. This suggests that investors are leaning towards a positive outlook for the altcoin.
Can Fantom Break Through the $1.15 Resistance for Further Gains?
Despite the recent bullish momentum, FTM has struggled to maintain its position above $1.13, facing resistance at this level. This is similar to the March rally when it was rejected after reaching nearly $1.15. For Fantom to continue its upward trajectory, breaching the $1.15 resistance would be important, as it could unlock further price gains.
Since November 23, when the altcoin’s 20-day EMA crossed above the 50-day SMA, a bullish trend has been visible as short-term momentum outpaced the longer-term trend.
Zooming in, Fantom is currently trading below the upper resistance of an ascending triangle. That indicates the market is still testing the breakout level on the 4-hour chart of the FTM/USDT trading pair.

Additionally, the daily chart shows an RSI of 69, approaching overbought conditions. But there is still room for upward movement with the Chaikin Money Flow (CMF) suggesting strong buying pressure.
Based on the recent price action and historical momentum, if FTM breaks the $1.15 resistance and closes a daily candle above this level, there’s a chance it could surge by nearly 40% to hit the $1.60 level. If it reaches this target, FTM may revisit $2. If the sentiment remains unchanged, FTM could climb even higher in the coming days.
However, given the volatile market conditions, immediate support was found at $1.07, with a drop to $0.99. At that point, the asset may sustain itself at $1 to $1.05 for a while before entering another bull trend.
