The on-chain analytics firm Glassnode has revealed how the Ethereum futures market is still overheated despite the long squeeze that just occurred.
In a new post on X, Glassnode has discussed about how the Ethereum futures market has changed during the past day. ETH, like other digital assets, has witnessed significant volatility inside this window. Sharp price action usually means chaos for the derivatives side of the sector and indeed, a large amount of liquidations have piled up on the various exchanges.
Given that the price action has been majorly towards the downside for Ethereum, the long investors would be the most heavily affected. Below is the chart shared by the analytics firm that shows the trend in the long liquidations related to ETH over the past year.

From the graph, it’s visible that the Ethereum futures market has just witnessed a massive amount of long liquidations. “Yesterday, $76.4M in ETH long liquidations hit the market, with $55.8M wiped out in a single hour – the second-largest spike in a year, just behind Dec 9’s $56M,” notes Glassnode.
These liquidations have meant that a notable ETH leverage flush-out has occurred on the derivatives platforms. Here is another chart, this time for the Open Interest, which showcases the market deleveraging:

The “Open Interest” is an indicator that keeps track of the total amount of Ethereum-related futures positions that are open on all centralized derivatives exchanges. At the start of the month, this metric was sitting around $20.5 billion, but after the mass liquidation event, its value has come down to $15.9 billion.
This suggests $4.6 billion in positions have been wiped out from the market. While this represents a large decrease, it has actually not been enough to cause a sufficient cooldown in the Open Interest.

As displayed in the above chart, the 365-day moving average (MA) of the Ethereum Open Interest is currently situated at $13 billion. Thus, the metric’s daily value is around 22% higher than the average for the past year.
This could be a potential indication that the leverage in the sector is still at elevated levels, despite the massive amount of liquidations that the long investors have suffered.
Historically, an overheated futures market has generally unwound with volatility for the coin’s price, so it’s possible that more sharp action could follow for ETH in the near future.
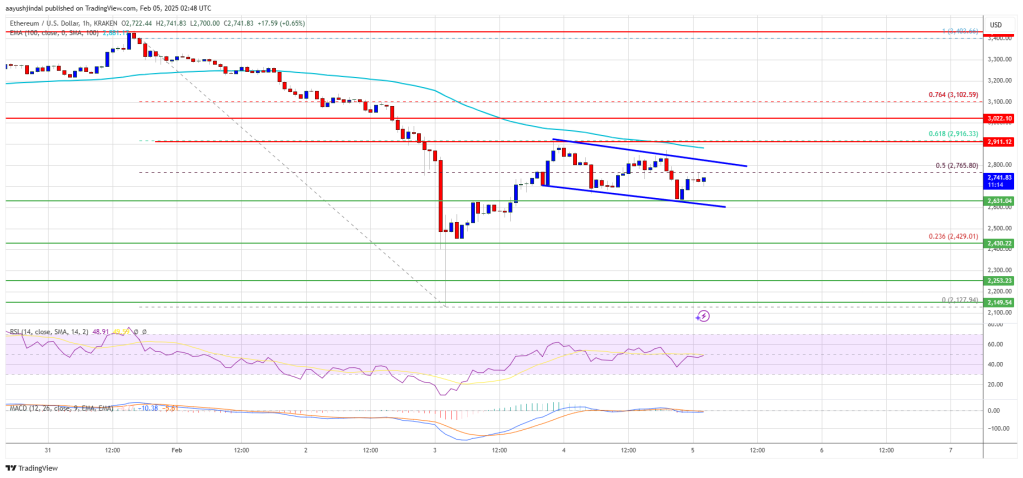
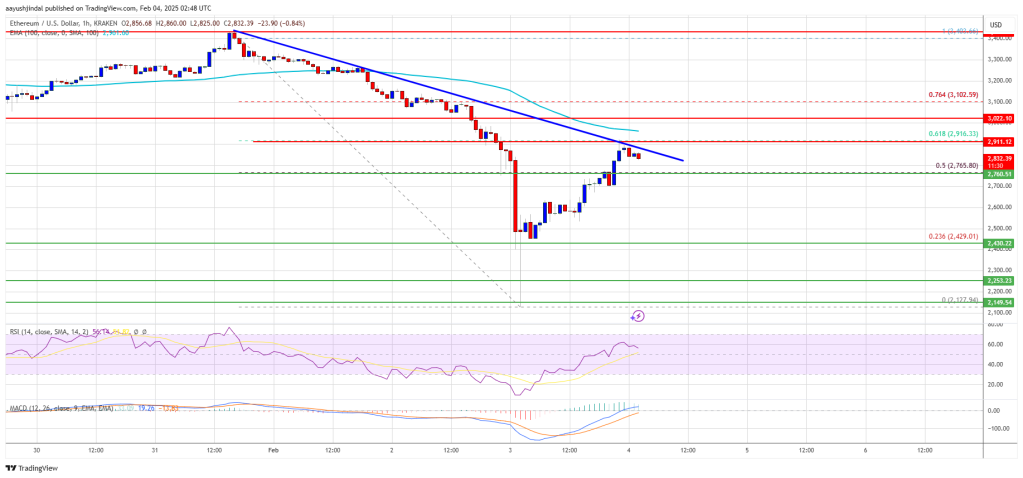
Ethereum saw a crash towards the $2,100 mark yesterday, but it would appear the cryptocurrency has seen a rebound as its price is now trading around $2,800.

Ethereum Open Interest Still Notably Above The Yearly Average
In a new post on X, Glassnode has discussed about how the Ethereum futures market has changed during the past day. ETH, like other digital assets, has witnessed significant volatility inside this window. Sharp price action usually means chaos for the derivatives side of the sector and indeed, a large amount of liquidations have piled up on the various exchanges.
Given that the price action has been majorly towards the downside for Ethereum, the long investors would be the most heavily affected. Below is the chart shared by the analytics firm that shows the trend in the long liquidations related to ETH over the past year.
From the graph, it’s visible that the Ethereum futures market has just witnessed a massive amount of long liquidations. “Yesterday, $76.4M in ETH long liquidations hit the market, with $55.8M wiped out in a single hour – the second-largest spike in a year, just behind Dec 9’s $56M,” notes Glassnode.
These liquidations have meant that a notable ETH leverage flush-out has occurred on the derivatives platforms. Here is another chart, this time for the Open Interest, which showcases the market deleveraging:
The “Open Interest” is an indicator that keeps track of the total amount of Ethereum-related futures positions that are open on all centralized derivatives exchanges. At the start of the month, this metric was sitting around $20.5 billion, but after the mass liquidation event, its value has come down to $15.9 billion.
This suggests $4.6 billion in positions have been wiped out from the market. While this represents a large decrease, it has actually not been enough to cause a sufficient cooldown in the Open Interest.
As displayed in the above chart, the 365-day moving average (MA) of the Ethereum Open Interest is currently situated at $13 billion. Thus, the metric’s daily value is around 22% higher than the average for the past year.
This could be a potential indication that the leverage in the sector is still at elevated levels, despite the massive amount of liquidations that the long investors have suffered.
Historically, an overheated futures market has generally unwound with volatility for the coin’s price, so it’s possible that more sharp action could follow for ETH in the near future.
ETH Price
Ethereum saw a crash towards the $2,100 mark yesterday, but it would appear the cryptocurrency has seen a rebound as its price is now trading around $2,800.