- Ethereum price in the past 24 hours has incurred an additional price dip of 3.61%.
- The altcoin’s daily trading volume has dipped by 18.77% as per CMC data.
Uptober’s failure to initiate the bull run yet, has caused a feeling of unrest in the crypto community. Significant cryptocurrencies have incurred major dips in the last 2 days, this has put investors in a tough spot. The decision to sell or buy the dip has been looming within the sector. Meanwhile, as aforementioned, Ethereum has shown significant price dips.
Notably, and contrary to expectations, Bitcoin has fallen to $61,000 after its recent rally to $66K. Mirroring this price action, the largest altcoin, Ethereum exhibited an additional 3.61% price drop over the last 24 hours. Looking back, the altcoin failed to show significant increases despite Bitcoin’s recent rally.
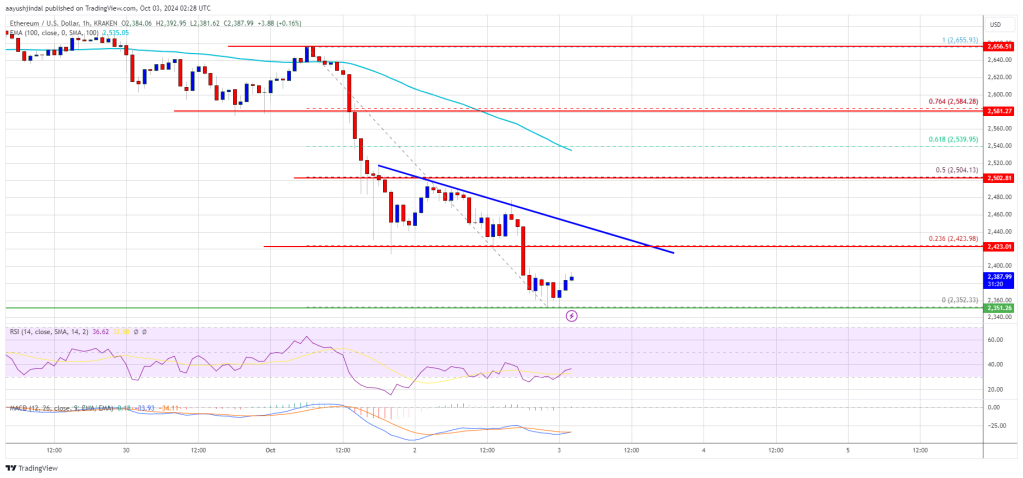
At the beginning of October 2, ETH traded at $2,491 before it began falling to its previous support level at the $2,300 levels. Moreover, the altcoin dipped to an intra-day low of $2,352 before attempting to recover. At the time of writing, Ethereum was trading at $2,388 as per CMC data.
Contrastingly, the US spot ETH ETFs have shown significant inflows in the last 24 hours. According to Sosovalue data, the ETP products recorded $14.45 million in daily net inflows on October 2. Additionally, BlackRock’s spot ETH ETFs recorded the highest inflows amounting to 18.04 million.
Is Ethereum (ETH) Price Anticipating Further Dips?
Over the past week, Ethereum has incurred a 8.18% price decrease as per TradingView data. In the beginning of the week, the altcoin traded at the $2,600 levels which resulted from a modest price dip during the time. Additionally, the token’s monthly performance stands at an approximate 5% dip while its YTD price increase is struggling to remain positive and is currently at 4.77%.
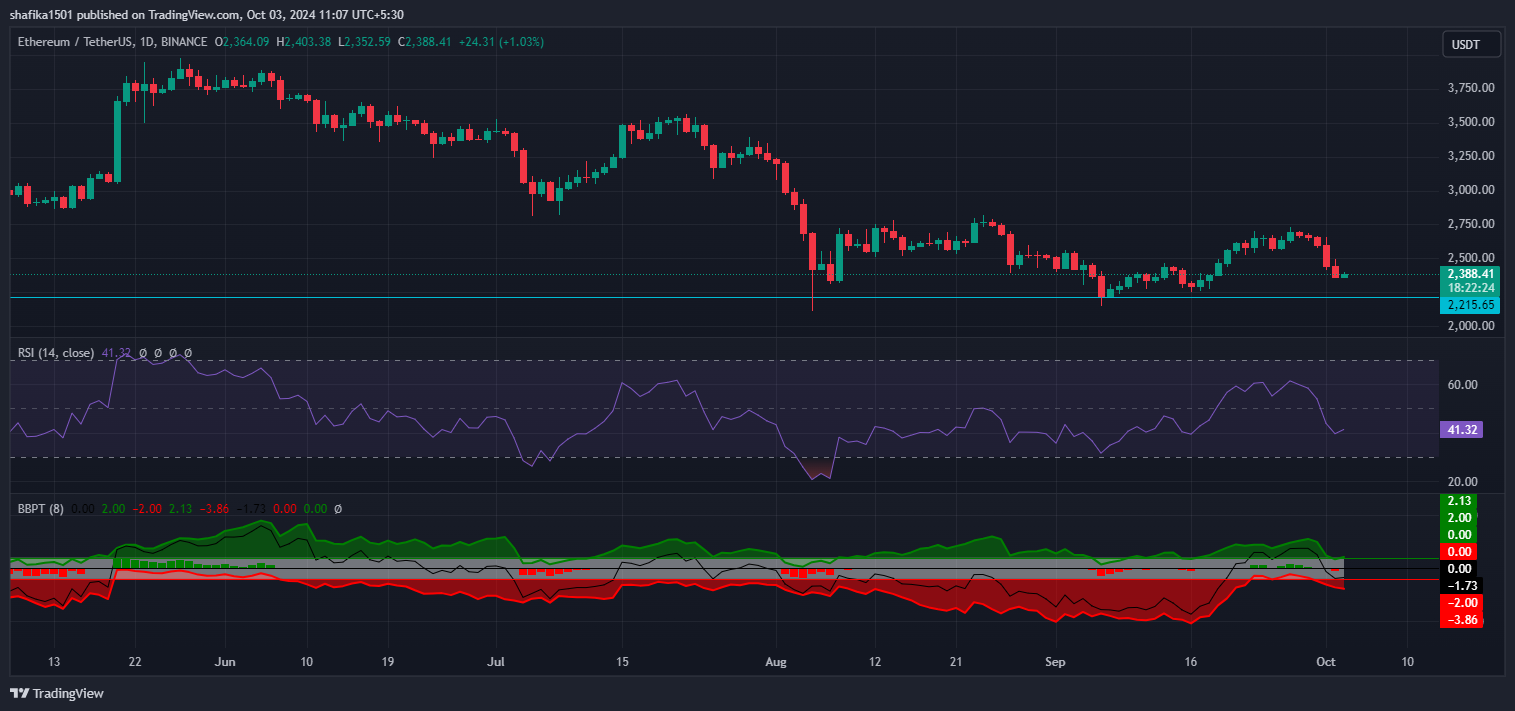
ETH/USDT Daily Price Chart (Source: TradingView)
Meanwhile, several Ethereum whales have shown selling activity in the past few weeks. The token’s RSI standing at 41.32 indicates the persistent selling pressures in the market. Furthermore, the token’s bull power indicator stands at 2.13 while the bear power indicator stands at 3.86 highlighting the bearish dominance.
Moreover, the token in case of continuing with the bearish trend might fall to a support of $2,215. However, for Ethereum to turn the price action towards the positive, it might require significant propellants.
Highlighted Crypto News Today:
Bitwise Officially Files Form S-1 for Spot XRP ETF with US SEC