Ethereum, the second-largest crypto by market capitalization, is currently exhibiting signs of a bullish breakout, as observed by two prominent analysts in the crypto space. According to World Of Charts, Ethereum shows consolidation within a bullish pennant pattern.
This technical formation typically suggests continuing an upward trend in Ethereum’s case. According to the analyst, if Ethereum successfully breaks out of this pattern, it could surge toward a significant level of $3,500.
Adding to World Of Charts’ optimistic outlook, crypto trader Skew has identified the $2,320–$2,382 range as a key resistance zone for Ethereum. This price range has historically acted as a barrier to Ethereum’s upward movement, with “numerous rejections” witnessed at these levels.
Skew emphasizes the importance of Ethereum closing above $2,400 on the 1-hour and 4-hour charts. This decisive move would breach the resistance zone and confirm Ethereum’s bullish momentum.
Skew also noted that technical indicators such as the Relative Strength Index (RSI) and stochastics still display significant momentum, supporting the potential for Ethereum’s continued upward trend.
Despite recent market turbulence, including the plunge of several cryptocurrencies, including BTC, following the Securities and Exchange Commission’s (SEC) fake spot ETF approval announcement, Ethereum has shown resilience and is currently in the green.
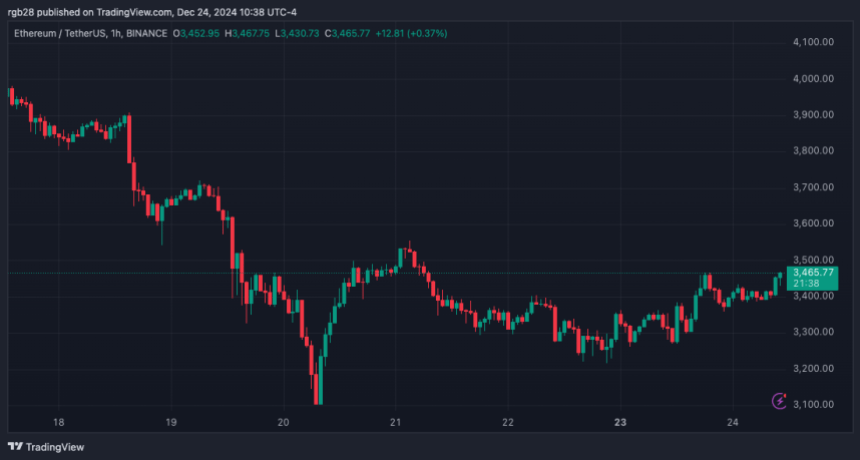
Over the past 24 hours, Ethereum has climbed by 5.5%, surpassing the $2,400 mark before a slight retracement to around $2,381 at the time of writing. This bullish trend is further supported by increased trading volume, which surged below $30 billion to approximately $39 billion in the past day.

Skew suggests that Ethereum’s bullish momentum could receive an additional boost from the potential approval of a Spot BTC ETF. If such approval were to come to fruition, it could further support Ethereum’s upward trajectory.
This sentiment is echoed by Michaël van de Poppe, another renowned crypto analyst, who also foresees Ethereum’s approach to its 2022 low as a precursor to a potential breakout. Van de Poppe believes that Ethereum’s current positioning near last year’s low could be crucial in absorbing liquidity and fueling a bullish breakout.
Van de Poppe’s analysis highlights the broader market context, specifically the awaited decision on a spot Bitcoin ETF in the US. An approval, he predicts, could notably impact the ETH/BTC trading pair, potentially triggering a sharp price movement known as a liquidation candle.
Following this, Van de Poppe anticipates a significant reallocation of funds into Ethereum, accompanied by a bullish weekly divergence, propelling Ethereum onto an upward trajectory.
Featured image from Unsplash, Chart from TradingView
This technical formation typically suggests continuing an upward trend in Ethereum’s case. According to the analyst, if Ethereum successfully breaks out of this pattern, it could surge toward a significant level of $3,500.
$Eth
Trend Is Up Consolidating In Bullish Pennant Expecting Breakout Soon Incase Of Successful Breakout Expecting Move Towards 3500$#Crypto #Eth #Ethusdt #Ethereum pic.twitter.com/nlqbMfh3k0
— World Of Charts (@WorldOfCharts1) January 10, 2024
Crucial Resistance Zone: Ethereum Path To Breakout
Adding to World Of Charts’ optimistic outlook, crypto trader Skew has identified the $2,320–$2,382 range as a key resistance zone for Ethereum. This price range has historically acted as a barrier to Ethereum’s upward movement, with “numerous rejections” witnessed at these levels.
Skew emphasizes the importance of Ethereum closing above $2,400 on the 1-hour and 4-hour charts. This decisive move would breach the resistance zone and confirm Ethereum’s bullish momentum.
Skew also noted that technical indicators such as the Relative Strength Index (RSI) and stochastics still display significant momentum, supporting the potential for Ethereum’s continued upward trend.
$ETH 4H Maybe it’s time for ETH to shine & run, would definitely help if the BTC Spot ETF is legitimately approved later
$2320 – $2382 has proven to be strong resistance with numerous rejections
the key confirmation would be a solid 1H & 4H close above $2400
4H trend &… pic.twitter.com/taWbcC7eWY
— Skew Δ (@52kskew) January 10, 2024
Ethereum’s Solo Bull Run Amid Market Turbulence
Despite recent market turbulence, including the plunge of several cryptocurrencies, including BTC, following the Securities and Exchange Commission’s (SEC) fake spot ETF approval announcement, Ethereum has shown resilience and is currently in the green.
Over the past 24 hours, Ethereum has climbed by 5.5%, surpassing the $2,400 mark before a slight retracement to around $2,381 at the time of writing. This bullish trend is further supported by increased trading volume, which surged below $30 billion to approximately $39 billion in the past day.
Skew suggests that Ethereum’s bullish momentum could receive an additional boost from the potential approval of a Spot BTC ETF. If such approval were to come to fruition, it could further support Ethereum’s upward trajectory.
This sentiment is echoed by Michaël van de Poppe, another renowned crypto analyst, who also foresees Ethereum’s approach to its 2022 low as a precursor to a potential breakout. Van de Poppe believes that Ethereum’s current positioning near last year’s low could be crucial in absorbing liquidity and fueling a bullish breakout.
Van de Poppe’s analysis highlights the broader market context, specifically the awaited decision on a spot Bitcoin ETF in the US. An approval, he predicts, could notably impact the ETH/BTC trading pair, potentially triggering a sharp price movement known as a liquidation candle.
Following this, Van de Poppe anticipates a significant reallocation of funds into Ethereum, accompanied by a bullish weekly divergence, propelling Ethereum onto an upward trajectory.
Featured image from Unsplash, Chart from TradingView


