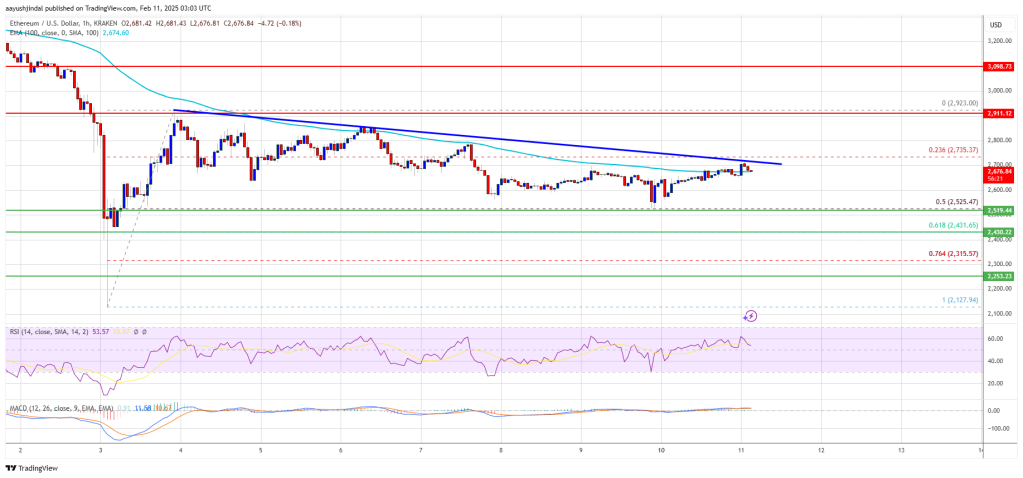
- ETH surged 3.2% to $2,715 on February 11 amid major withdrawals from centralized exchanges.
- Whale activity saw 56,909 ETH withdrawn, resulting in a record net outflow of 224,410 ETH and exchange holdings dropping to 9.63M ETH.
- Positive signals like an upward A/D trend, narrowing Bollinger Bands, and a record-low exchange supply ratio of 0.137 underscore strong long-term investor confidence.
Ethereum posted a significant price gain in the last 24 hours. The cryptocurrency increased 3.2% to $2,715 on February 11. This followed a trend where large quantities of ETH were withdrawn by numerous investors from centralized exchanges.
Whale Activity:
Blockchain statistics indicate that whale addresses are transferring large quantities off exchanges. One wallet whose address started with 0xb99a withdrew 56,909 Ethereum from Binance. The withdrawal is worth approximately $151.6 million. Another wallet whose address started with 0xEd0C withdrew 64,603 ETH from Binance and Bitfinex worth approximately $171.8 million. The transactions indicate that large holders prefer self-custody to having funds on exchanges.
It seems that whales are accumulating $ETH!
0xb99a…BcF5 withdrew 56,909 $ETH($151.6M) from #Binance 4 hours ago.
0xEd0C…4312 withdrew 64,603 $ETH($171.8M) from #Binance and #Bitfinex in the past 48 hours.https://t.co/hLMs0ziEUIhttps://t.co/TXrSYqOSKQ pic.twitter.com/a6Oe20q946
— Lookonchain (@lookonchain) February 11, 2025
Santiment statistics indicate that approximately 224,410 ETH left exchanges on February 8-9. This is the biggest one-day net outflow in almost two years. Consequently, available Ethereum tokens on exchanges have decreased dramatically. As of February 11, only approximately 9.63 million Ethereum remains in known exchange wallets. This is the lowest balance since August 29, 2024. Fewer tokens on exchanges generally mean less immediate selling pressure, which stabilizes prices.
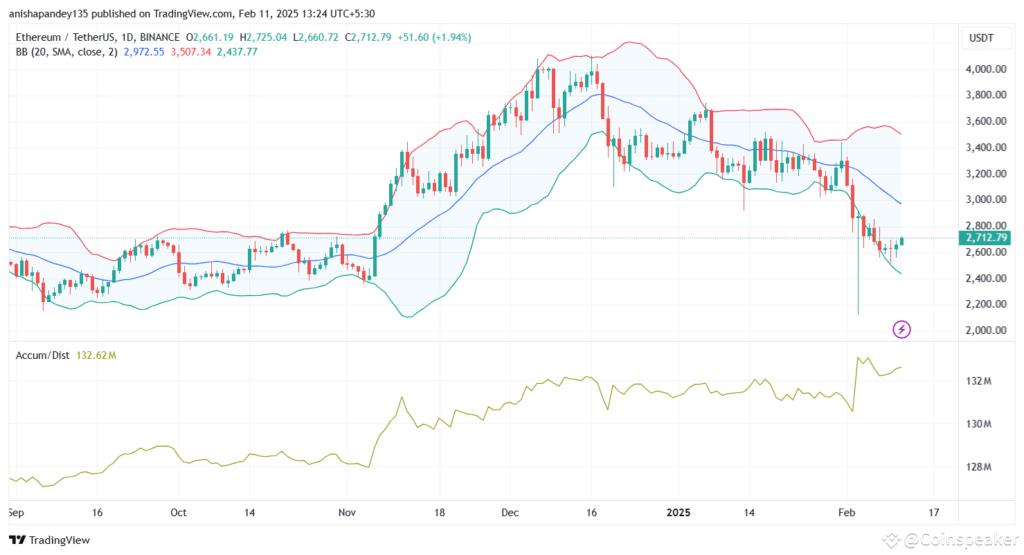
Other metrics also indicate growing investor confidence. The Accumulation/Distribution (A/D) metric on Ethereum’s daily chart is trending upward, indicating that investors are purchasing ETH despite recent volatility. Bollinger Bands on the daily chart indicate that ETH is holding near the lower band while gradually trending towards the middle band. This configuration indicates higher volatility and the possibility of a breakout if buying pressure increases.
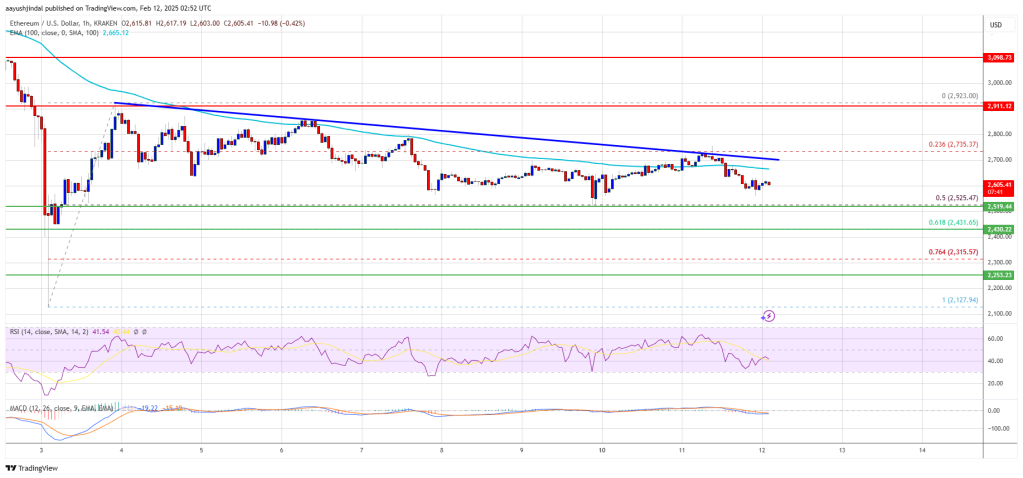
Some analysts believe that if ETH can break the $2,850 resistance level, the price may rally to $2,975, with the next target being $3,050. However, if the $2,660 support level is broken, ETH may drop to the $2,500 level. Market sentiment remains cautious as traders consider these possibilities.
Additional information from CryptoQuant shows that the exchange supply ratio for ETH has dropped to an all-time low of 0.137. Meanwhile, new capital inflows have injected $6 billion into the market over the past week. These trends, combined with the prevailing trend of moving from exchanges to individual wallets, reflect strong long-term sentiment among investors. Overall, Ethereum’s recent price rally and large outflows from exchanges reflect a market skewed towards holding and not selling, which can support price stability and potential upward movement.
Highlighted Crypto News Today
WazirX Recovery Plan Real Redemption or Another Scam?