- Bitcoin’s multi-timeframe analysis suggests a potential bullish rally.
- Technical patterns indicate a positive outlook for Bitcoin’s price movement.
- Caution is advised due to cryptocurrency market volatility and unforeseen events.
In a recent report to TheNewsCrypto, a pseudonymous analyst unveiled an exciting multi-timeframe analysis of Bitcoin (BTC). The findings provide valuable insights into the leading cryptocurrency’s potential bullish rally, igniting anticipation among traders and investors.
The Weekly Time Frame Unveils Promising Pattern
According to the reports, upon careful examination of Bitcoin’s weekly and daily charts, technical experts have identified compelling patterns that point to a bright future for Bitcoin enthusiasts. The weekly time frame reveals the formation of an Inverted Head and Shoulder Pattern, a highly reliable technical formation known for signaling potential reversals.
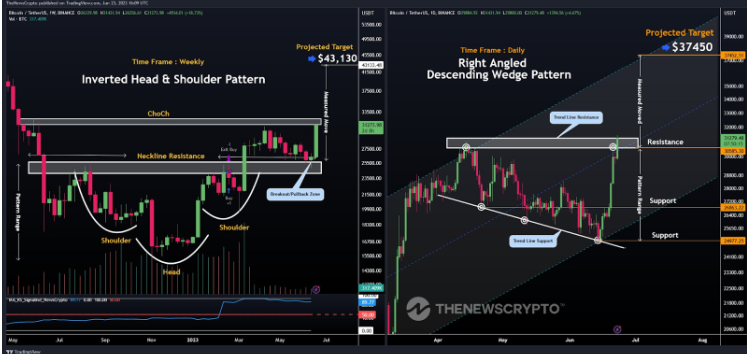
Moreover, the breakthrough above the neckline resistance level on March 13, 2023, marked the initiation of a long-term upward trend for BTC. Following this breakthrough, Bitcoin entered a consolidation phase, trading between $25,600 to $31,100 from mid-March to early June 2023.
Excitingly, between June 13 and June 23, Bitcoin experienced an impressive rally, surging by approximately $5,000. Consequently, BTC surpassed the $30K mark since the month of April. This significant price increase indicates a robust bullish sentiment prevailing in the current market.
Additionally, experts point to the projected target derived from the Inverted Head and Shoulder Pattern range, suggesting a possible Bitcoin price of $43,130. This projection further validates the positive outlook on BTC.
Daily Time Frame Unveils Bullish Reversal Signal
Shifting the focus to the daily time frame, Bitcoin’s trading pattern reveals an ascending channel formation. In addition, astute analysts have also noticed a Right Angled Descending Broadening Wedge pattern within the channel. This pattern is widely recognized as a bullish reversal signal, further amplifying the optimism surrounding Bitcoin’s future price movements.
Similarly, analyzing the price action pattern and measuring the potential move of the Right Angled Descending Broadening Wedge, technical analysts project that Bitcoin could rally by another $6,000 from its current level of $31,120. This implies a projected target of $37,450, adding more weight to the positive sentiment surrounding Bitcoin’s upward momentum.
While the multi-timeframe analysis showcases promising trends across weekly and daily time frames, investors must exercise caution and perform in-depth research. The cryptocurrency market remains susceptible to volatility and unforeseen events that can impact price movements.
Nevertheless, the comprehensive analysis of Bitcoin provides traders and investors with valuable insights, reinforcing the bullish sentiment surrounding the cryptocurrency. As Bitcoin continues to break key patterns and projections point to a significant rally, market participants eagerly anticipate the next phase of Bitcoin’s ascent.
Disclaimer: Any information contained in this article is not proposed to be and doesn’t constitute financial advice, investment advice, trading advice, or any other advice. The NewsCrypto is not responsible to anyone for any decision made or action taken in conjunction with the information and/or statements in this article.
Highlighted Crypto News Today:
Litecoin’s Imminent Halving Event: Anticipating Market Impact Post-Halving
