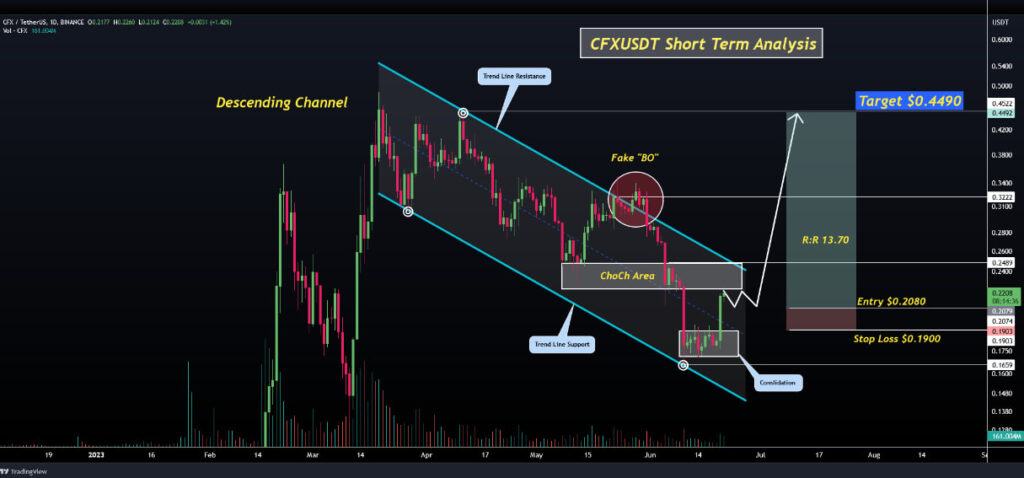
- Conflux currently displays an intriguing Descending Channel Pattern.
- Traders eye a target price of $0.449 for CFX.
In this technical analysis, let’s examine the price action of CFXUSDT within a descending channel pattern on the daily time frame. Technical analysis is a method used by traders and investors to analyze historical price data and identify potential future price movements based on patterns, trends, and indicators.
CFXUSDT is a trading pair representing the price of Conflux (CFX) quoted in USDT. The descending channel pattern is a technical chart pattern characterized by a series of lower highs and lower lows, indicating a downward trend in the price movement.
From June 10th to June 20th, the price of CFX exhibited a period of consolidation near the support level within the descending channel. This consolidation phase suggests a temporary equilibrium between buyers and sellers, often referred to as a period of indecision. During this time, market participants may be accumulating positions, preparing for a potential shift in market sentiment.
The subsequent range breakout, which is the price movement beyond the upper boundary of the consolidation range, indicates a potential change in momentum. Breakouts are significant events in technical analysis as they signify a shift in the balance between supply and demand, often leading to substantial price movements.
Currently, the price of CFXUSDT is approaching the resistance area within the descending channel. The resistance level represents a price level at which selling pressure has historically been strong, causing the price to reverse or consolidate. Traders and investors closely monitor the resistance area as a potential key level for a breakout, which could signal a bullish rally and a potential trend reversal.
By analyzing the technical patterns and price action, traders can develop trade setups and strategies to capitalize on potential market opportunities. In the following sections, we will outline a trade setup for CFXUSDT based on the observed price dynamics and provide specific entry, target, and stop loss levels to guide traders in their decision-making process.

CFX Price Chart (Source: TradingView)
CFX Price Analysis: Trade Setup
Entry Point: According to the Smart Money Concept, a suitable entry point for this trade setup is at $0.2080, preferably after the breakout above the resistance area. This entry level aligns with the expectation of a bullish rally following the breakout.
Target: The target for this trade setup is set at $0.4490, indicating a significant upside potential from the entry level. This target reflects the anticipated price movement once the breakout above the resistance area is confirmed. Traders should consider monitoring the price action and adjust their targets accordingly.
Stop Loss: To effectively manage risk, it is recommended to set a stop loss at $0.1900. Placing the stop loss below the entry level helps protect against potential downside risks. Traders should be mindful of adjusting their stop loss level as the trade progresses, considering factors such as price volatility and market conditions.
CFXUSDT has been trading within a descending channel pattern, and recent price action suggests a potential bullish breakout. Traders can consider entering the trade after the breakout above the resistance area at $0.2080, with a target set at $0.4490. It is essential to implement a stop loss at $0.1900 to manage risk effectively. As with any trading decision, it is crucial to conduct thorough analysis, monitor the market, and adjust the strategy based on changing conditions.
Disclaimer: Any information contained in this article is not proposed to be and doesn’t constitute financial advice, investment advice, trading advice, or any other advice. The NewsCrypto is not responsible to anyone for any decision made or action taken in conjunction with the information and/or statements in this article.


