- Solana trades at $244, gaining over 2.80%.
- Solana has experienced $14.86 million in liquidations over the past 24 hours.
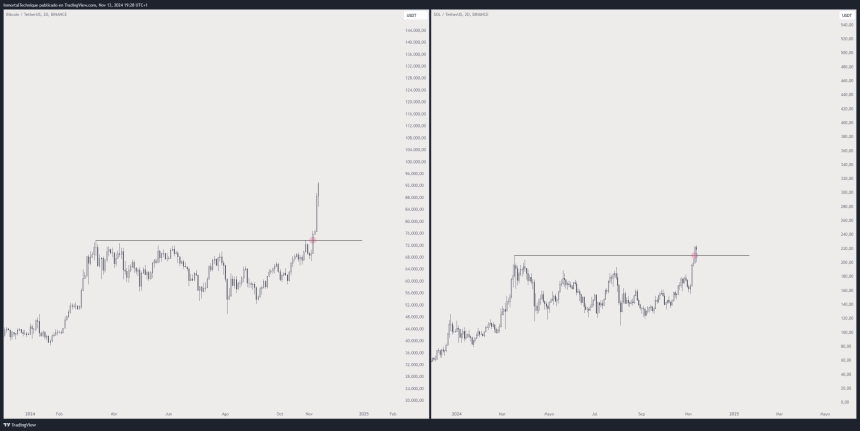
Bitcoin (BTC) crosses above the $98K mark, setting a new all-time high at $98,342. The BTC rally has altered the altcoin market, causing major assets, except Ethereum (ETH), to gain momentum. Among them, Solana has broken through its crucial resistance above $230.
Notably, the altcoin has a moderate spike of 2.82%. With a $116 billion market cap, Solana trades at $244.81. The intra-day trading price of SOL is noted at $237. Later, the asset has climbed to the current trading level.
Meanwhile, Solana has witnessed a 24-hour liquidation of $14.86 million, as per Coinglass data. Consequently, the daily trading volume of SOL has reached $7.72 billion.
Inferring the weekly price chart, Solana has recorded a 13.20% gain. The asset began trading at the downside—$215.63. As days progressed, the altcoin gained momentum and jumped to a high of $248.19.
Can SOL Rise Above Bearish Pressure?
The ongoing market sentiment of Solana rests in the neutral zone, as the daily relative strength index (RSI) is found at 57.66. In addition, the daily frame of SOL displays the short-term 9-day moving average beneath the long-term 21-day moving average.
SOL’s four-hour price chart pointed out the downside correction. The current trading momentum has the potential to pull the price back to the nearby support level of $232.57. If the price plunges even deeper, SOL might slip to a low in the $225 range.
On the flip side, where the bullish momentum retrieves its lost strength, SOL could likely mount to the $253.71 mark. Further upside correction might drive the price of Solana even higher. Moreover, The asset is just 6.96% away from hitting a new all-time high at $260.06.
In addition, Solana’s technical indicators exposed the current bearish momentum, inferring the Moving Average Convergence Divergence (MACD) line. It is perhaps positioned below the signal line, indicating the forthcoming downtrend within the market.
SOL chart (Source: TradingView)
The Chaikin Money Flow (CMF) indicator is found at 0.03 suggesting a brief positive money flow, which also highlights a possible spike in demand ahead. In the meantime, the daily trading volume of SOL has soared by over 17%.
Highlighted Crypto News
Why Is Ethereum (ETH) Stalling at $3.1K While Bitcoin Surges?
