Hold the $98K Level, or Is a Dip Incoming?")
- Bitcoin is trading within the $97.6K range.
- The market has witnessed $44.52 million in BTC liquidations.
The largest asset, Bitcoin (BTC) continues to dominate the cryptocurrency market as its price movements are crucial. BTC reflects a period of consolidation following multiple drops. Bitcoin’s price is suffering to reclaim the $100K mark, facing repeated rejections that triggered sharp pullbacks.
The price action of the asset has established a series of lows and highs as it fails to maintain the momentum above the $100K mark. Intraday fluctuations have been notable, with BTC visiting a low of $94,745 and a high of $97,977.
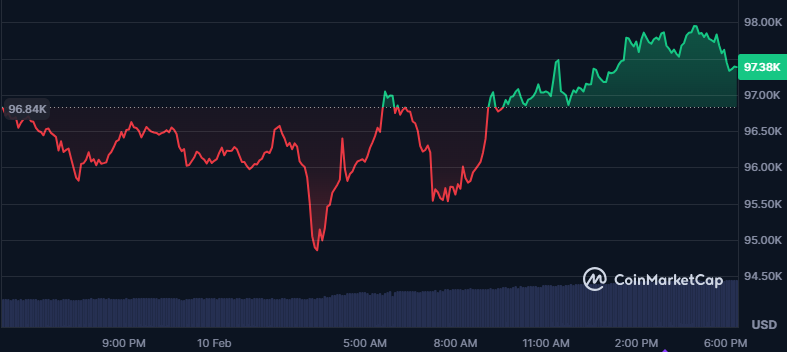
BTC price chart (Source: CMC)
BTC’s series of declines has been testing crucial support around $95K. The asset opened the day trading at $96,837. The asset has spiked by over 1.12%, and at press time, Bitcoin trades at $97,684. Consequently, the asset has stepped into the neutral zone as the Fear and Greed Index stays at 43.
Furthermore, during this timeframe, the market has witnessed a 24-hour liquidation of $44.52 million worth of Bitcoin. Also, the daily trading volume of the asset has reached $37.83 billion.
Will Bitcoin Bulls Take Charge or Will Bears Prevail?
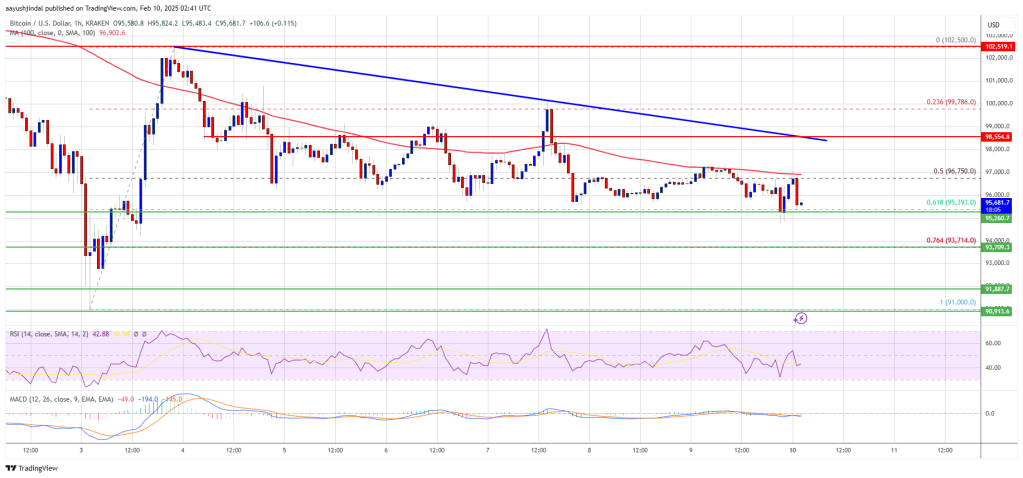
The four-hour Bitcoin candlestick chart reports a broader bearish sentiment. The mixed market signals have kept BTC trapped in a consolidation phase. The asset is trading close to the key support level at $95,748, and further losses could trigger selling. That would put additional pressure, extending BTC’s correction.
A bounce off to $99,764 could trigger Bitcoin to reclaim the $100K level. Assuming breaching this barrier would nullify the negative trend and see a resurgence in demand. Hence, it could break above the crucial $105K threshold and might attempt to revisit its all-time high of $109,114 hit 21 days ago.
BTC’s Moving Average Convergence Divergence (MACD) line and signal line are settled below the zero line. It indicates a strong bearish outlook and selling pressure dominates the market. As long as both remain below the zero line, the overall trend remains weak.
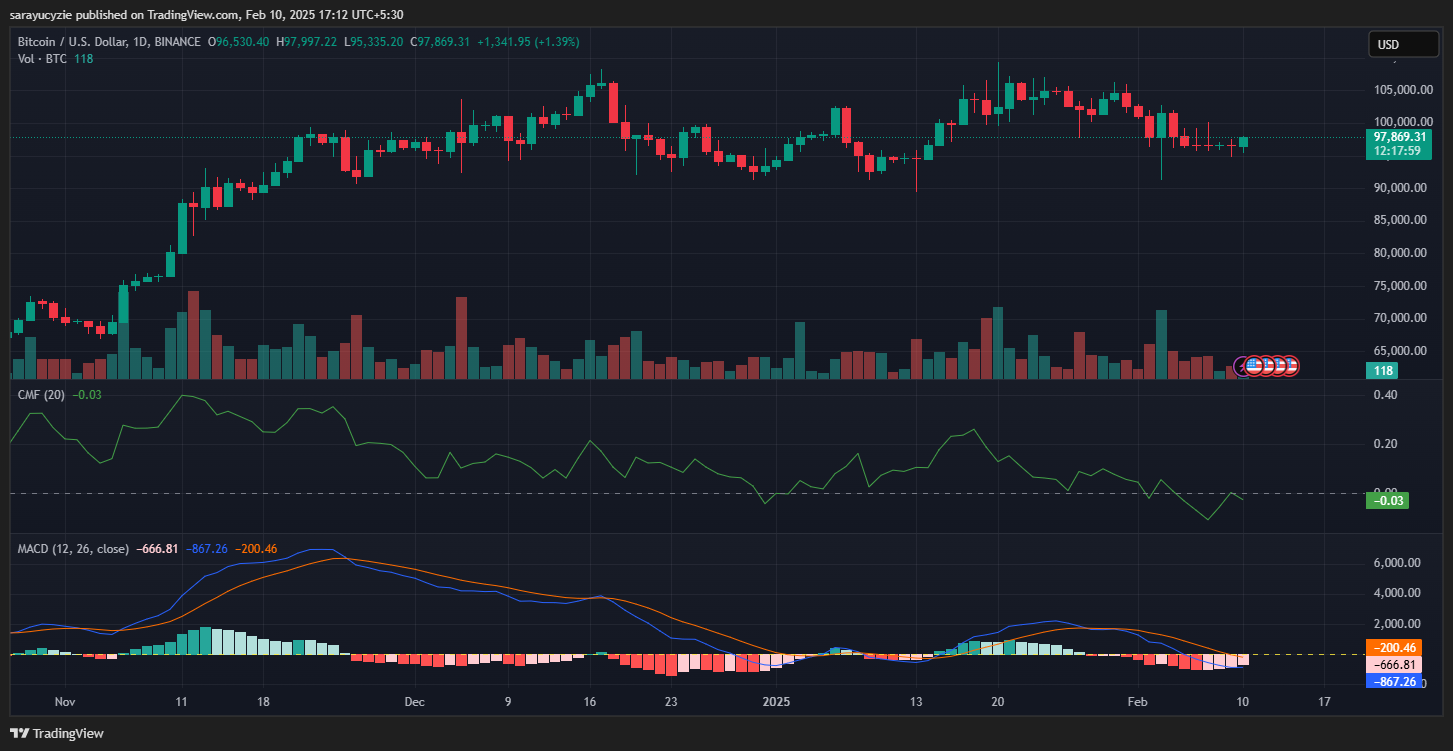
BTC chart (Source: TradingView)
In addition, the Chaikin Money Flow (CMF) indicator stationed at -0.03 highlights bearish pressure. The selling pressure is slightly stronger than the buying pressure. Meanwhile, the daily trading volume of the asset has increased by over 63.90%.
Moreover, Bitcoin’s daily relative strength index (RSI) at 45.73 points out the neutral to slightly bearish momentum. Notably, the Bull Bear Power (BBP) of -3.891 suggests that bears are in control with selling pressure outweighing buying momentum.
Disclaimer: The opinion expressed in this article is solely the author’s. It does not represent any investment advice. TheNewsCrypto team encourages all to do their own research before investing.
Highlighted Crypto News
Can FET Challenge the Bears and Reclaim $1?