- Aave’s market cap stands at $5.49 billion, with a 36.01% increase in trading volume.
- The market cap to TVL ratio is 0.2567, reflecting a strong balance between value locked and market valuation.
Aave (AAVE) has experienced a notable surge in price, reaching $389.52 before settling at $366.47, reflecting a 2.69% increase in the past 24 hours. This uptick is significant given the current market conditions, with AAVE’s market cap now sitting at $5.49 billion, up by 2.68%.
The token’s trading volume has surged to $2.11 billion, marking a 36.01% rise, which has contributed to the positive momentum. Additionally, the market cap to TVL ratio stands at 0.2567, indicating a healthy balance between the total value locked and the token’s market valuation. The surge in AAVE’s price can be attributed to recent fund acquisitions.
Aave’s impressive growth is partly fueled by dormant tokens waking up, cutting AAVE’s “Mean Dollar Invested Age” and driving major gains. Over the past 30 days, AAVE has surged by 96%, with a staggering 290% increase in the last year.
In the past five hours, the fund purchased 37,052 LINK tokens, valued at $1 million, alongside 685.4 AAVE, worth $247,000. These strategic acquisitions have boosted the value of both tokens, with LINK’s value rising by $232,000 and AAVE’s increasing by $217,000. These developments have positively impacted AAVE’s market outlook and are contributing to the current price rally.
Technical Analysis of Aave
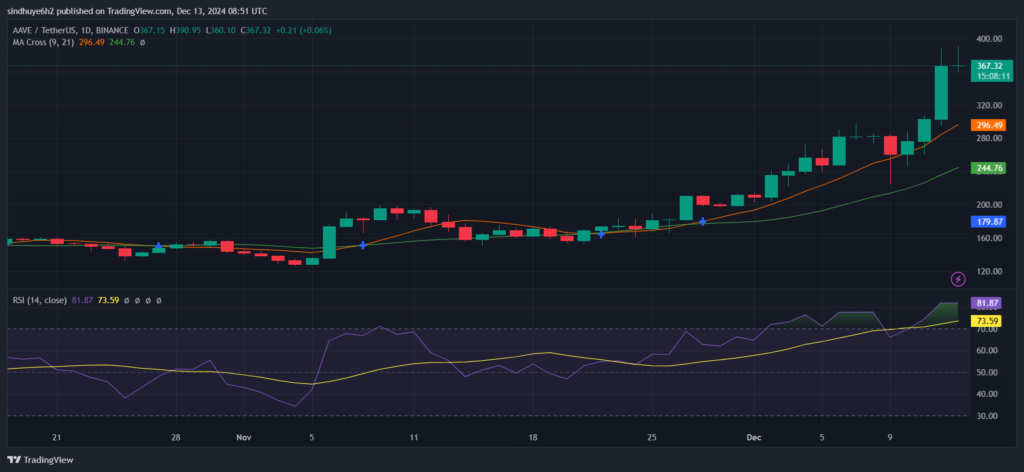
Examining Aave’s technical indicators, we can derive key support and resistance levels. From the provided chart, the current support level is observed around the $244.71 range, with AAVE showing resilience above it.
If AAVE breaks below this level, the price could potentially retest the next support at $179.87. On the other hand, AAVE faces resistance at the $366.25 mark, which has been tested recently. A breakthrough above this level could propel the price toward $390 or even higher, establishing new highs.

The Relative Strength Index (RSI) currently stands at 81.51, indicating that AAVE is in an overbought condition. The RSI average is 73.57, suggesting that the momentum could slow down in the near term unless it consolidates. This indicates that caution is advised, as AAVE may experience some price corrections if the RSI continues to climb.
The Moving Average (MA) crossovers also provide valuable insight. The chart shows that the 9-period moving average is above the 21-period MA, signaling a bullish trend. This cross implies that AAVE could continue its upward movement, provided it maintains the current price levels and does not experience a drastic pullback.
Highlighted Crypto News Today
Will Trump’s World Liberty Financial Continue Buying LINK and AAVE?


