On-chain data shows the presence of a massive Bitcoin supply wall around the $97,200 level, something that could impede BTC’s advances beyond the mark.
In a new post on X, the market intelligence platform IntoTheBlock has discussed how BTC support and resistance levels are looking from an on-chain perspective right now. In on-chain analysis, the potential of any price level to act as support or resistance lies in the amount of supply that was last transferred or purchased at it. Below is the chart shared by the analytics firm, that shows the supply distribution of the cryptocurrency at price levels near the current spot Bitcoin value.

In the graph, the size of the dot correlates to the amount of BTC that the investors bought in the corresponding price range. It would appear that the $96,400 to $98,400 range currently has a particularly large dot associated with it, which implies these levels host the cost basis of a significant number of holders.
More specifically, around 1.6 million addresses last acquired a total of 1.57 million BTC inside the range. Since Bitcoin is trading under these levels at the moment, all of these investors would be underwater.
Holders in loss can be desperate to recoup their investment, so selling from them can sometimes occur as soon as the price of the cryptocurrency rises back to its cost basis.
Naturally, such selling is of no relevance to the asset when just a few investors participate in it, but when the price is retesting a range holding the acquisition level of a significant number of addresses, a reaction large enough may be produced to influence the asset’s value.
The $96,400 to $98,400 range is clearly quite large, so it’s possible that it could be the reason why Bitcoin has been unable to find any bullish breaks during the past week.
Just like how supply blocks above the spot price can end up acting as a source of resistance for the asset, those below can be a point of support. This happens because investors who were once in profit may believe that the price would go up again in the near future so they could decide to double down on their bet, taking advantage of the ‘dip’.
Currently, $93,400 to $96,200 is the strongest support wall that BTC has out of the nearby ranges. However, it contains a lower amount of supply than the aforementioned resistance block, meaning that its effect should be weaker.
If the support range is lost, there are only thin walls waiting for Bitcoin up to $81,800. It now remains to be seen whether Bitcoin can surpass the resistance, or if it would find itself retesting one of these weaker support levels.
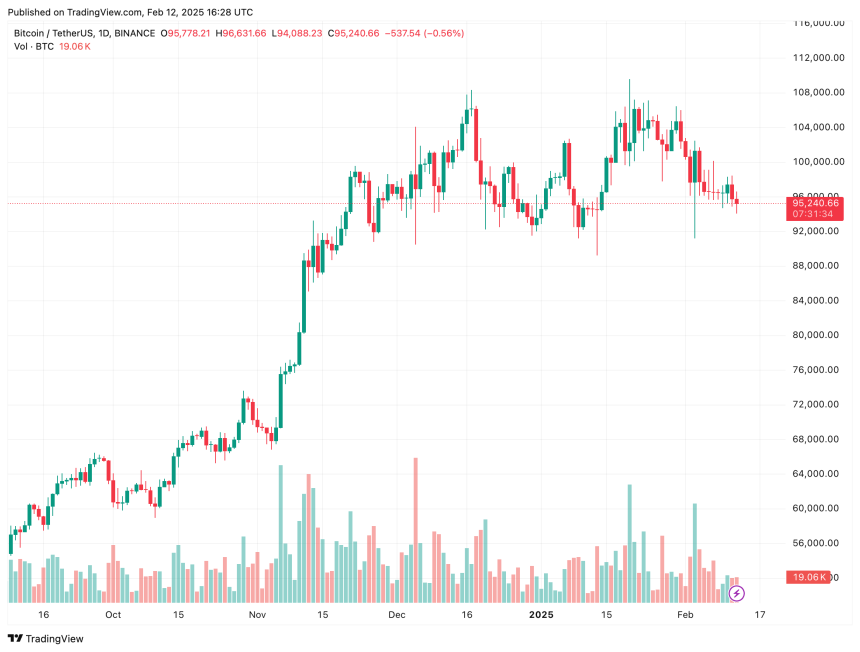
At the time of writing, Bitcoin is floating around $96,000, down around 2% in the last 24 hours.

Bitcoin Has Significant Resistance At Price Levels Just Ahead
In a new post on X, the market intelligence platform IntoTheBlock has discussed how BTC support and resistance levels are looking from an on-chain perspective right now. In on-chain analysis, the potential of any price level to act as support or resistance lies in the amount of supply that was last transferred or purchased at it. Below is the chart shared by the analytics firm, that shows the supply distribution of the cryptocurrency at price levels near the current spot Bitcoin value.
In the graph, the size of the dot correlates to the amount of BTC that the investors bought in the corresponding price range. It would appear that the $96,400 to $98,400 range currently has a particularly large dot associated with it, which implies these levels host the cost basis of a significant number of holders.
More specifically, around 1.6 million addresses last acquired a total of 1.57 million BTC inside the range. Since Bitcoin is trading under these levels at the moment, all of these investors would be underwater.
Holders in loss can be desperate to recoup their investment, so selling from them can sometimes occur as soon as the price of the cryptocurrency rises back to its cost basis.
Naturally, such selling is of no relevance to the asset when just a few investors participate in it, but when the price is retesting a range holding the acquisition level of a significant number of addresses, a reaction large enough may be produced to influence the asset’s value.
The $96,400 to $98,400 range is clearly quite large, so it’s possible that it could be the reason why Bitcoin has been unable to find any bullish breaks during the past week.
Just like how supply blocks above the spot price can end up acting as a source of resistance for the asset, those below can be a point of support. This happens because investors who were once in profit may believe that the price would go up again in the near future so they could decide to double down on their bet, taking advantage of the ‘dip’.
Currently, $93,400 to $96,200 is the strongest support wall that BTC has out of the nearby ranges. However, it contains a lower amount of supply than the aforementioned resistance block, meaning that its effect should be weaker.
If the support range is lost, there are only thin walls waiting for Bitcoin up to $81,800. It now remains to be seen whether Bitcoin can surpass the resistance, or if it would find itself retesting one of these weaker support levels.
BTC Price
At the time of writing, Bitcoin is floating around $96,000, down around 2% in the last 24 hours.