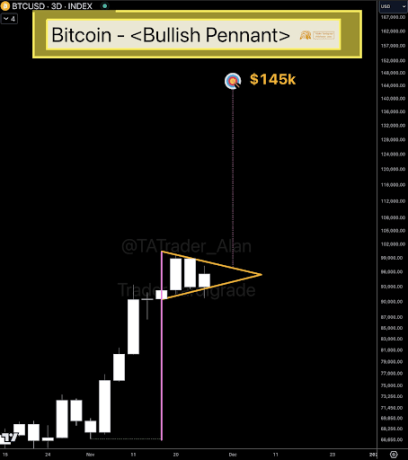
The Bitcoin price movements have recently formed a bullish symmetrical triangle pattern, a technical indicator that often precedes significant upward momentum. This pattern formation has come amidst a back and forth between $93,477 and $85,970 after the Bitcoin price reached an all-time high of $93,477 on November 14.
The observation of this bullish symmetrical triangle was highlighted on the social media platform X by the crypto analyst known as Stockmoney Lizards, who is also credited with developing the Satoshimeter indicator.
A symmetrical triangle is formed when a descending resistance line and an ascending support line converge, indicating a period of consolidation. As the price approaches the apex of this formation, it typically breaks out in the direction of the prevailing trend.
In the case of Bitcoin, the Bitcoin price action on the daily candlestick timeframe has been one of a series of lower highs and higher lows for about the past week. This formation has led to the Bitcoin price trading in an increasingly tightening range, which is ultimately going to breakout in either direction.
For Bitcoin, the existing uptrend suggests a potential breakout above the upper trendline of the symmetrical triangle, which is just below $91,000. To confirm such a breakout, analysts look for a spike in trading volume and at least two consecutive closes beyond the trendline.
Commenting on this setup, the Stockmoney Lizards stated, “The current setup suggests a potential breakout to the next level. All eyes are on 100k. This is when retail investors will crush the candy store and the real fun will start.”
Such a breakout, if confirmed, could lead Bitcoin to establish new highs above the six-digit threshold of $100,000, which in turn would trigger a wave of inflows into other cryptocurrencies.
The psychological milestone of $100,000 has been a focal point for Bitcoin enthusiasts and analysts since the beginning of this bull cycle. Notably, the calls for a $100,000 price target have been even more pronounced since the Bitcoin price broke above its March high of $73,737 earlier this month.
At the time of writing, Bitcoin is trading at $91,770, having reached an intraday high of $92,653 in the past 24 hours. This means it has effectively broken out of the symmetrical triangle since Stockmoney Lizards’ technical analysis. Interestingly, the analyst highlighted this breakout in an update to his analysis.
Now that the breakout of the symmertical triangle has been effectively confirmed, it remains to be seen whether the Bitcoin price can reach the coveted $100,000 price mark before the end of November. All indicators point to go, with the demand for Bitcoin currently far outpacing the supply.

The observation of this bullish symmetrical triangle was highlighted on the social media platform X by the crypto analyst known as Stockmoney Lizards, who is also credited with developing the Satoshimeter indicator.
Symmetrical Triangle Points To A Bitcoin Price Breakout
A symmetrical triangle is formed when a descending resistance line and an ascending support line converge, indicating a period of consolidation. As the price approaches the apex of this formation, it typically breaks out in the direction of the prevailing trend.
In the case of Bitcoin, the Bitcoin price action on the daily candlestick timeframe has been one of a series of lower highs and higher lows for about the past week. This formation has led to the Bitcoin price trading in an increasingly tightening range, which is ultimately going to breakout in either direction.
For Bitcoin, the existing uptrend suggests a potential breakout above the upper trendline of the symmetrical triangle, which is just below $91,000. To confirm such a breakout, analysts look for a spike in trading volume and at least two consecutive closes beyond the trendline.
Commenting on this setup, the Stockmoney Lizards stated, “The current setup suggests a potential breakout to the next level. All eyes are on 100k. This is when retail investors will crush the candy store and the real fun will start.”
Such a breakout, if confirmed, could lead Bitcoin to establish new highs above the six-digit threshold of $100,000, which in turn would trigger a wave of inflows into other cryptocurrencies.
Next Bitcoin Price Target: $100,000
The psychological milestone of $100,000 has been a focal point for Bitcoin enthusiasts and analysts since the beginning of this bull cycle. Notably, the calls for a $100,000 price target have been even more pronounced since the Bitcoin price broke above its March high of $73,737 earlier this month.
At the time of writing, Bitcoin is trading at $91,770, having reached an intraday high of $92,653 in the past 24 hours. This means it has effectively broken out of the symmetrical triangle since Stockmoney Lizards’ technical analysis. Interestingly, the analyst highlighted this breakout in an update to his analysis.
Now that the breakout of the symmertical triangle has been effectively confirmed, it remains to be seen whether the Bitcoin price can reach the coveted $100,000 price mark before the end of November. All indicators point to go, with the demand for Bitcoin currently far outpacing the supply.


