- Bitcoin remains undervalued according to long-term indicators.
- ETF inflows and strong technicals support continued growth.
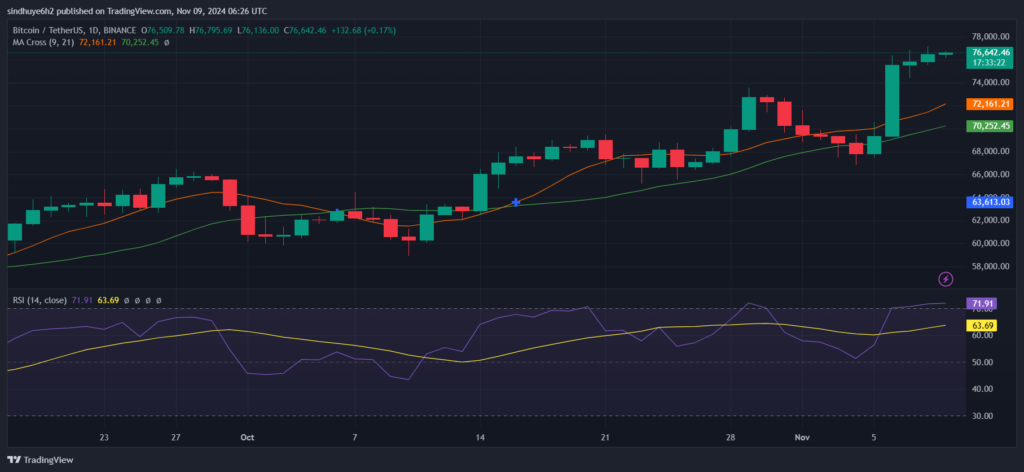
Bitcoin (BTC) reached an all-time high today, surging to $77,000. Currently trading around $76,683, BTC has seen a 0.96% increase over the past day, with a trading volume of approximately $51.33 billion. This brings its market capitalization to $1.52 trillion, holding a market cap ratio of 3.38%.
The latest rally indicates sustained demand, supported by both technical indicators and substantial inflows into BTC-focused ETFs. The milestone is supported by several key indicators that suggest there’s room for further growth, though caution is advised as the $80,000 level could present some retracement risks.
Recent ETF flows have added further volatility to Bitcoin’s movements, especially amid the heightened focus during the U.S. election period. Notably, BTC ETFs saw their second-largest outflow on November 4, followed by record inflows on November 7. BlackRock, a prominent institutional investor, increased its BTC holdings by 16,254 BTC, valued at approximately $1.25 billion, demonstrating solid support for Bitcoin’s growth and fueling optimism among investors.

This heightened crowd enthusiasm often signals overextension, which could lead to a retracement as profit-taking behavior sets in. The RSI, holding steady at 61.87, suggests moderate upward momentum, while the recent “Golden Cross” between the 50-day and 200-day moving averages indicates a bullish trend with potential for continued gains.
The Five Indicators For BTC
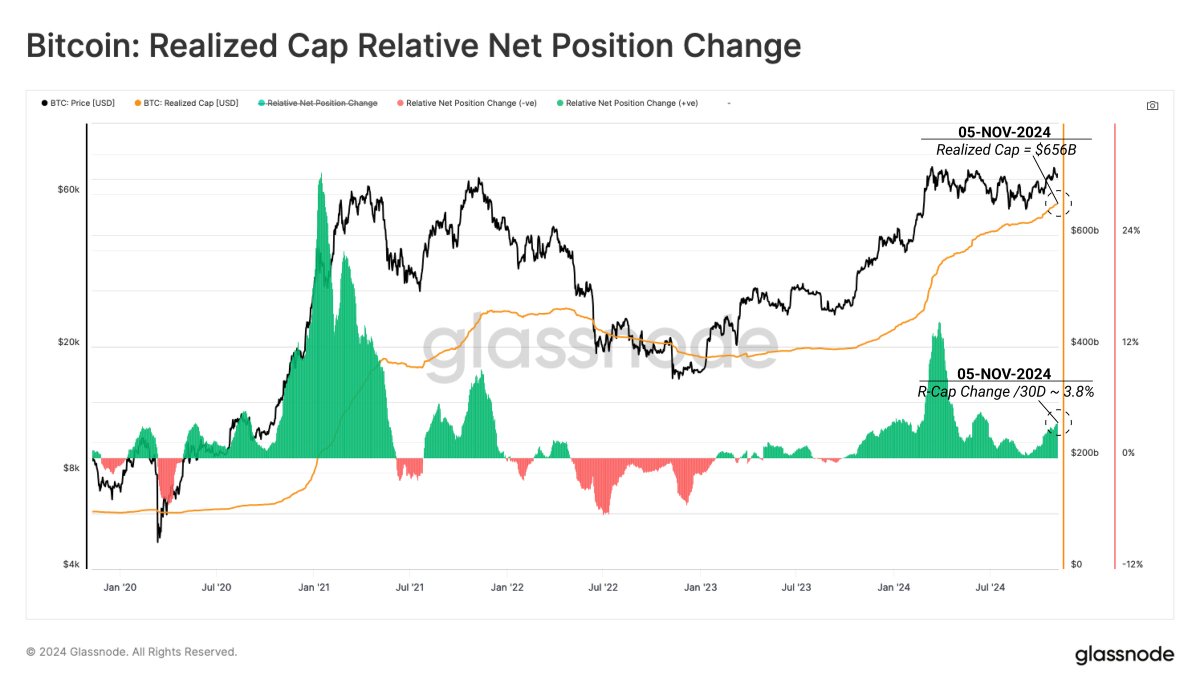
The Bitcoin Rainbow Chart, a long-term valuation tool, continues to show Bitcoin as undervalued, indicating potential for further price appreciation. The updated Rainbow2023 Chart places BTC in the “cheap” zone, suggesting that even at $77K, Bitcoin may still be far from its peak.
1/ The price of #Bitcoin experienced two major crashes in August!
Will it keep dropping or bounce back from the bottom?
Let's use 5 indicators to decide whether to escape from the #Bitcoin top. pic.twitter.com/C3DjDzFWCx
— Lookonchain (@lookonchain) August 29, 2024
Meanwhile, the Relative Strength Index (RSI) currently stands at 61.87, which is below the overbought threshold of 70. This implies that Bitcoin is not overbought territory and supports continued growth without signaling an immediate risk of reversal. However, this level should be monitored for potential changes with sentiment turning bullish.
The 200-week Moving Average Heatmap further reinforces the possibility of additional upside, as Bitcoin remains in the “blue” zone, a signal that the price has not yet reached a top. This indicator suggests a favorable environment for holding or buying, pointing to further gains ahead.
Likewise, the Cumulative Value Days Destroyed (CVDD) indicator, which typically highlights undervaluation, shows Bitcoin is still in a favorable buy zone, adding weight to the idea that BTC hasn’t yet touched historically significant peak levels. The 2-Year MA Multiplier also indicates that Bitcoin is positioned for growth, as it remains between the red and green lines, a range that has traditionally signaled more upside potential.
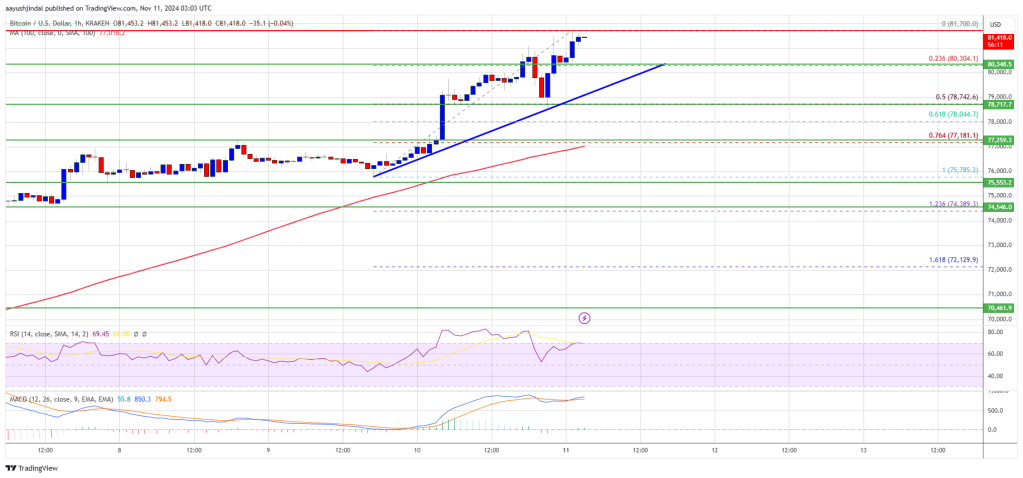
Bitcoin currently finds strong support around $73,500, with resistance at $77,280. Should BTC break through this resistance, the next target could be $80,000. However, Santiment has observed increased FOMO (fear of missing out) among investors as Bitcoin approaches the $80,000 mark.
Highlighted Crypto News Today
Vitalik Buterin Envisions a Wider Scope for Prediction Markets


