- Bitcoin (BTC) trades at $57.8K, losing 0.53% in the last 24 hours.
- BTC continues to stay within the fear zone in the market.
Bitcoin’s price performance has remained under pressure for the past few months. The largest asset’s crucial challenge is to break free from its narrow trading range of $50K to $60K.
The ongoing market volatility blocks Bitcoin from making an upward movement. Over the past 24 hours, the asset has plunged by 0.53%. After reaching a peak of $58,534, it dropped to $57,354, suggesting the extended bear hold. At press time, BTC traded at $57,862, as per CMC data. Consequently, BTC continues to be in the fear zone as the Fear and Greed Index stays at 32.
Notably, the most anticipated Federal Reserve’s potential rate cut, the upcoming presidential election, and the crucial U.S. economic data might impact the BTC price. On the other hand, Bitcoin mining wallets have witnessed a drop in supply since early 2024. However, a potential rebound could signal the beginning of the bull market.
Recently, the investment giant BlackRock mentioned that Bitcoin could act as a hedge in times of global instability and declining trust in traditional systems like governments, banks, and fiat currencies.
When Will BTC Hit its New High?
On the monthly chart, BTC price has witnessed a steady drop of 5.20%, forming a series of lows. A brief upside price correction was expected amid the volatility. Over the past seven days, the asset has witnessed a moderate spike of 2.22%, jumping from $56.5K to $57.9K.
The current bearish momentum might trigger BTC to collapse to the $57K level. If the negative pace persists, a strong pullback could drive the price to $56,818. On the other hand, a revival above the current price brings a retest, and BTC might escalate toward $59,064.
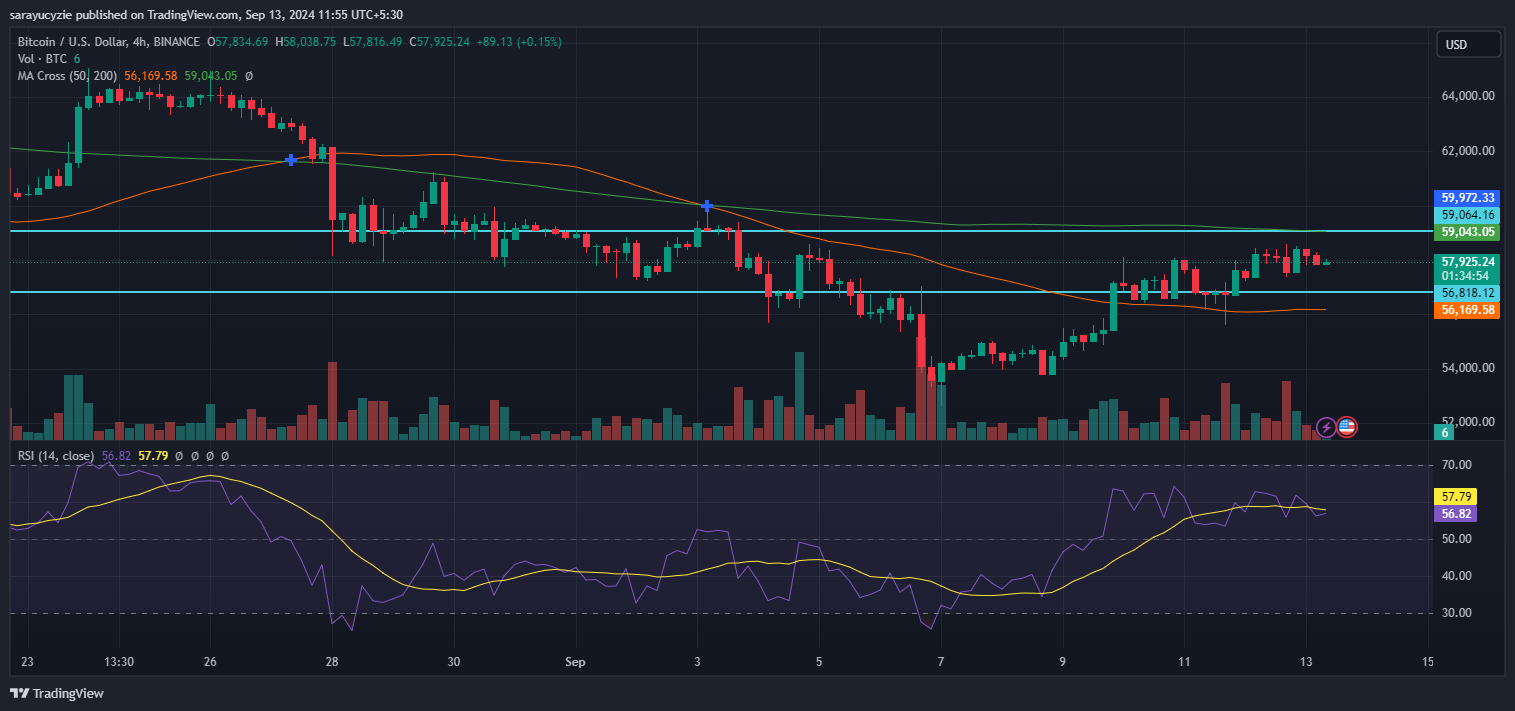
BTC price chart (Source: TradingView)
The technical analysis indicates that the daily Relative Strength Index (RSI) is positioned at 56.82 in the neutral zone. Moreover, the short-term 50 MA is noted at $56,169 above the current price momentum. While the long-term 200 MA is found below the current price at $59,043.
Highlighted Crypto News
Amarnath Founder James Fickel Swaps $11M in ETH for WBTC