On-chain data shows the Bitcoin exchange reserve has shot up during the past day, indicating that more drawdown may be coming for the price.
A few days back, a crash shook both Bitcoin and the wider cryptocurrency market, as the BTC price plummeted from above $29,000 to below $26,000 instantly.
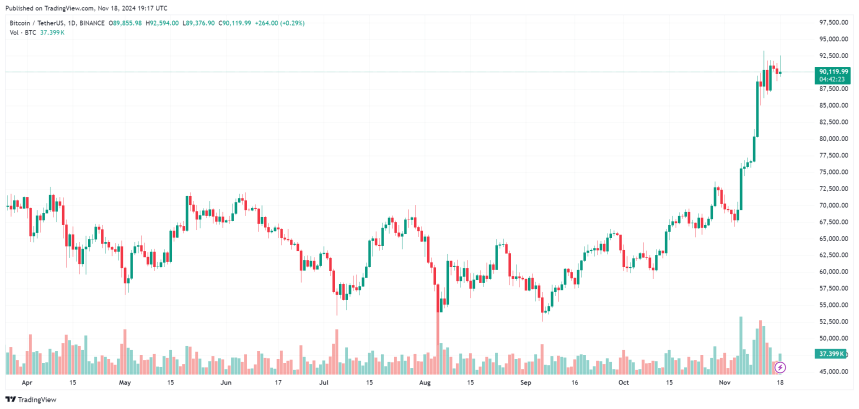
In the days since then, the asset has failed to show any signs of recovery, either, as its value has only continued to move sideways, as the chart below displays.

Bitcoin is trading around $25,800, suggesting a decline of 11% during the past week. This weekly performance of the number one asset in the sector is worse than some of the other top coins, like Ethereum (ETH) and Cardano (ADA).
It’s currently unclear whether the asset has hit its bottom, or if more decline is on the horizon, but if on-chain data is anything to go by, the latter may be more likely. As pointed out by an analyst in a CryptoQuant post, the exchange reserve has risen during the past few hours.
The “exchange reserve” here refers to a measure of the total amount of Bitcoin currently being stored inside the wallets of all centralized exchange platforms.
When the value of this metric goes up, the investors are depositing a net amount of the asset to these platforms right now. As one of the main reasons holders may transfer their coins to the exchanges is for selling-related purposes, this trend can cause bearish implications for the cryptocurrency’s price.
On the other hand, decreases in the indicator’s value imply the holders are taking their BTC off these central entities. Such a trend may be a sign that the investors are accumulating currently, which can naturally be bullish for the cryptocurrency in the long term.
Now, here is a chart that shows the trend in the Bitcoin exchange reserve over the past week or so:

The graph shows that the Bitcoin exchange reserve has registered a sharp uptick in the last few hours, implying that investors have been depositing big to these platforms.
The chart shows that the indicator also rose during the buildup to the crash, but the sharpness of the growth being observed this time is on another level.
In the lower graph, the quant has attached the data for the individual reserves of Coinbase and Binance, as well as for all spot and derivative platforms. It’s apparent that most of the rise has come from the derivative side of the market, with Binance seeing the largest spike.
Investors use spot exchanges for selling, so the fact that most of the deposits have been towards derivative platforms may imply that investors are just looking to open up new positions on the futures market, which can also lead to more volatility. Still, the direction of it could go either way.
Nonetheless, the spot exchange reserve has also observed a rise (although much smaller in scale), suggesting that a selloff might still be possible.
Bitcoin Exchange Reserve Has Registered A Large Increase
A few days back, a crash shook both Bitcoin and the wider cryptocurrency market, as the BTC price plummeted from above $29,000 to below $26,000 instantly.
In the days since then, the asset has failed to show any signs of recovery, either, as its value has only continued to move sideways, as the chart below displays.
Bitcoin is trading around $25,800, suggesting a decline of 11% during the past week. This weekly performance of the number one asset in the sector is worse than some of the other top coins, like Ethereum (ETH) and Cardano (ADA).
It’s currently unclear whether the asset has hit its bottom, or if more decline is on the horizon, but if on-chain data is anything to go by, the latter may be more likely. As pointed out by an analyst in a CryptoQuant post, the exchange reserve has risen during the past few hours.
The “exchange reserve” here refers to a measure of the total amount of Bitcoin currently being stored inside the wallets of all centralized exchange platforms.
When the value of this metric goes up, the investors are depositing a net amount of the asset to these platforms right now. As one of the main reasons holders may transfer their coins to the exchanges is for selling-related purposes, this trend can cause bearish implications for the cryptocurrency’s price.
On the other hand, decreases in the indicator’s value imply the holders are taking their BTC off these central entities. Such a trend may be a sign that the investors are accumulating currently, which can naturally be bullish for the cryptocurrency in the long term.
Now, here is a chart that shows the trend in the Bitcoin exchange reserve over the past week or so:

The graph shows that the Bitcoin exchange reserve has registered a sharp uptick in the last few hours, implying that investors have been depositing big to these platforms.
The chart shows that the indicator also rose during the buildup to the crash, but the sharpness of the growth being observed this time is on another level.
In the lower graph, the quant has attached the data for the individual reserves of Coinbase and Binance, as well as for all spot and derivative platforms. It’s apparent that most of the rise has come from the derivative side of the market, with Binance seeing the largest spike.
Investors use spot exchanges for selling, so the fact that most of the deposits have been towards derivative platforms may imply that investors are just looking to open up new positions on the futures market, which can also lead to more volatility. Still, the direction of it could go either way.
Nonetheless, the spot exchange reserve has also observed a rise (although much smaller in scale), suggesting that a selloff might still be possible.


