- Bitcoin (BTC) surged by over 15.26% in a week, hitting yearly highs of $35,000.
- In the short term, Bitcoin faces immediate resistance at $34651.
In a month aptly named “Uptober,” Bitcoin (BTC) keeps up to its position with a significant surge in price. Over the past week, Bitcoin has notched up substantial gains, climbing by over 15.26% to settle around $34,100 after reaching yearly highs of $35,000, a major breakthrough.
The journey from a low of $26,833 on October 14th to a peak of $35,263 showcases a remarkable 31.4% ascent. This upward trajectory aligns with an increase in trading volumes and a resounding bullish sentiment, providing convincing indicators of a sustainable recovery.
However, despite this newfound stability, the road ahead remains enfolded in uncertainty. The potential approval of future Exchange-Traded Funds (ETFs) could propel the market even further.
Bitcoin (BTC) 24-H Analysis
At the time of writing, BTC is trading at $34,120, down 0.07% in the last 24 hours, as per data from CoinMarketCap. Further, the trading volume is down 18.68%. Following the recent upsurge, the price has been up 29.24% in the last 30 days. The day saw Bitcoin reach a high of $34,155 and a low of $33,450.
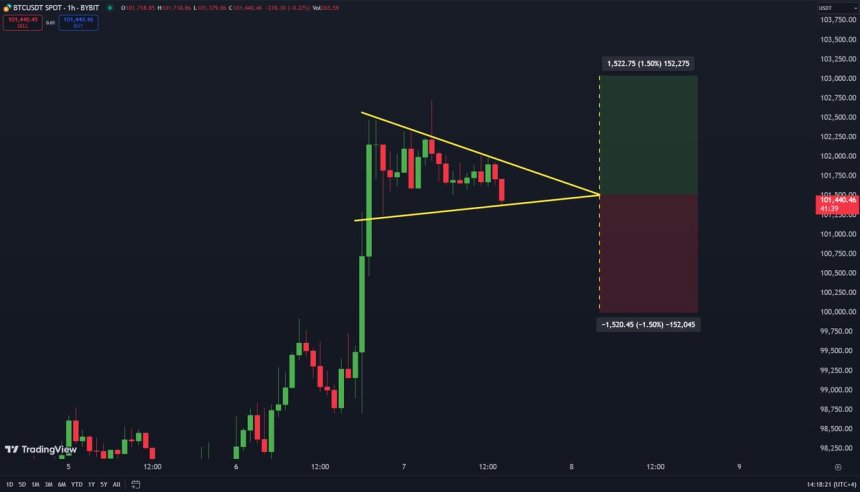
Bitcoin (BTC) Price Chart (Source: TradingView)
Analyzing the 24-hour chart, a pivotal point emerges at $34,651, with immediate resistance revealed at $35,000. If the current bullish momentum persists, the next jump appears at $34,800 and subsequently at $35,320. On the flip side, support levels are strategically positioned at $33,910, followed by $33,760 and $33,350.
When delving into the technical indicators, the Relative Strength Index (RSI) stands at 81, firmly signaling an overbought sentiment. Additionally, the price slightly hovers above the 50-day Exponential Moving Average (EMA50), suggesting a potential short-term bullish trend.
