- Bitcoin remarkable 23% surge sparks optimism in the market.
- Glassnode’s data reveals the growing trend of BTC HODLing.
Bitcoin, the largest cryptocurrency by market capitalization, has sent the entire community into a joyful frenzy with its remarkable bull run, a sight unseen for over a year. Bears had held sway since the beginning of the year, thwarting the attempts of the bulls to stage a comeback. However, last week marked a significant shift, etching a historic chapter in the crypto saga of 2023.
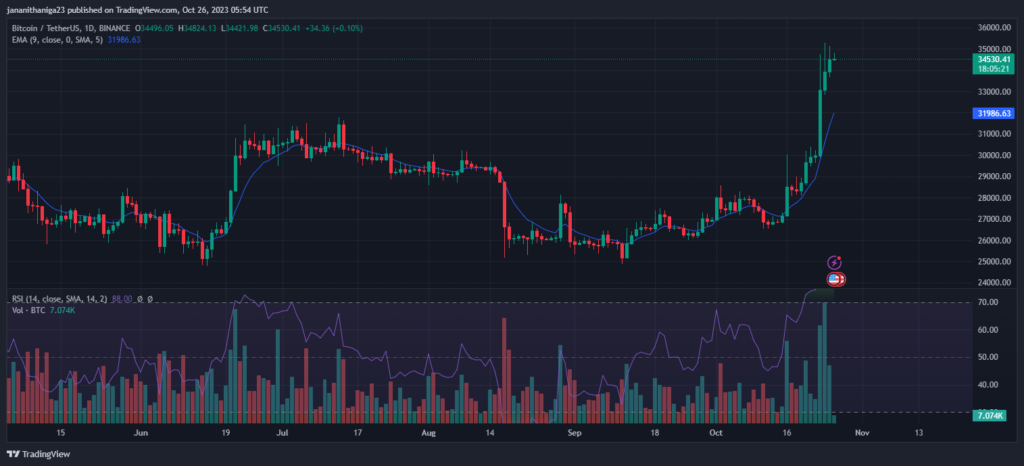
During that remarkable week, Bitcoin surged by 23%. It commenced the week with its trading price hovering around $28,000, but it shattered the $29,000 resistance level. On October 23, it soared to $34,787, followed by reaching a 17-month high of $35,292 on October 24. After a minor dip, it maintained its momentum, trading between $33,000 and $34,000. Then it surpassed $35,000 yet again yesterday, solidifying its bullish trend.
The anticipation of Bitcoin ETFs has been a pivotal driver of these price fluctuations, igniting hope within the community and traders that unprecedented highs may be reached once the ETFs receive approval. A week ago, false reports of ETF approval from a popular media outlet managed to temporarily silence the Bitcoin bears, further emphasizing the significance of ETF news.
Last week’s bull run can largely attribute its cause to an incident involving BlackRock’s (BLK) spot Bitcoin ETF ticker, IBTC, which temporarily disappeared from the Depository Trust & Clearing Corporation’s (DTCC) website. Although the ticker was subsequently relisted, this event generated speculations surrounding ETF approval.
Moreover, a recent assessment by prominent crypto data aggregator Glassnode regarding the state of Bitcoin revealed a growing trend of “HODLing,” as over 600,000 BTC have remained dormant for the last decade. This amount surpasses the BTC available on exchanges, indicating significant market dynamics.
Will The BTC Bulls Remain Stronger?
A closer analysis of Bitcoin’s current price movements reveals the dominance of bullish forces. The 9-day exponential moving average (EMA) is situated below the current trading price of $32,003. Simultaneously, the daily relative strength index (RSI) stands above 70, indicating that the asset has entered overbought territory.

BTC Price Chart, Source: TradingView
If Bitcoin succeeds in breaking the $36,000 mark, a rally toward $46,100 appears highly likely. Conversely, if the price were to dip below the crucial support level of $28,160, a downward move toward $27,250 becomes a plausible scenario. Further declines could lead to price testing at the $26,600 support level.


