Data shows the ratio between two Bitcoin on-chain metrics has recently formed a pattern that has historically been bullish for the asset’s price.
In a new post on X, CryptoQuant author Axel Adler Jr has discussed about the recent trend in the Bitcoin SOPR Ratio. The “Spent Output Profit Ratio” (SOPR) is an indicator that tells us about whether the Bitcoin investors as a whole are selling at a profit or loss.
When the value of this metric is greater than 1, it means the average holder is making BTC transactions at a net profit. On the other hand, it being under the mark implies loss-taking is dominant on the network.
The SOPR Ratio, the actual metric of interest here, keeps track of the ratio between the version of the SOPR specifically for short-term holders and that for long-term holders.
Short-term holders (STHs) and long-term holders (LTHs) are the two main divisions of the Bitcoin userbase made on the basis of holding time. The cutoff between these cohorts is 155 days, with investors who hold past this mark moving from the STHs to the LTHs.
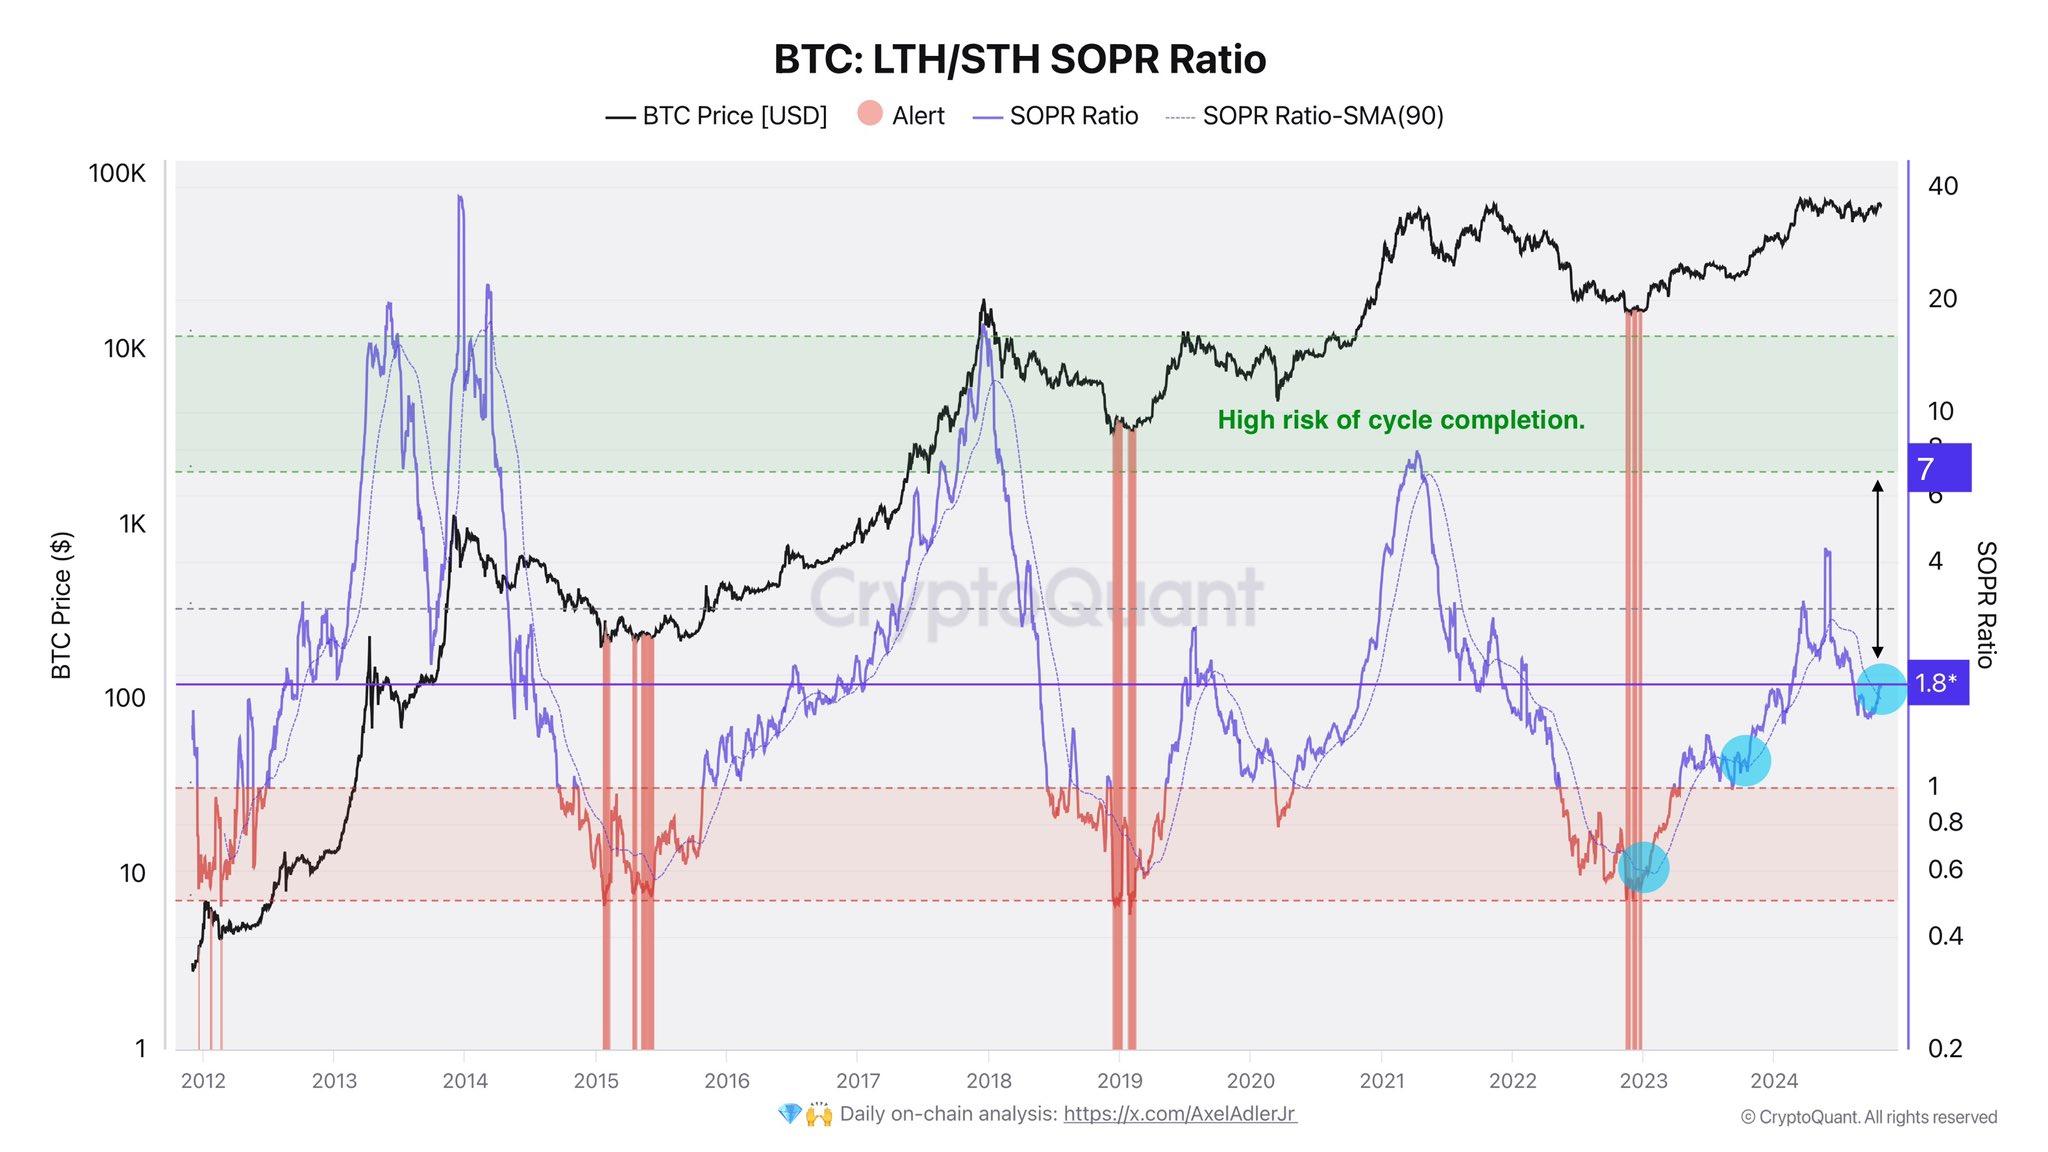
Now, here is the chart shared by the analyst that shows the trend in the Bitcoin SOPR Ratio and its 90-day moving average (MA) over the history of the cryptocurrency:

As displayed in the above graph, the Bitcoin SOPR Ratio has seen a surge recently, which suggests the LTHs have been ramping up their profit-taking compared to the STHs.
This trend is something that has historically been witnessed during bullish periods, since the LTHs are resolute entities who tend to amass large profits by the time the bull run hits in full swing.
The STHs are by definition the holders who bought within the past five months, meaning that their cost basis lies somewhere around the prices that BTC was trading at inside this window.
Thus, their profits are never as big as the LTHs, who often have their cost basis close to bear market lows. This is why the ratio blows up toward the LTHs in bullish periods.
With the latest increase, the SOPR Ratio has reached a value of 1.8 and has surpassed its 90-day MA. In the chart, the CryptoQuant author has highlighted the past instances of this crossover. It would appear that this pattern has generally proven to be bullish for Bitcoin.
Naturally, the profit-taking from the LTHs can be a concern, but as is apparent from the graph, the cycle has usually only been at risk of topping out when the ratio has broken above a value of 7.
Thus, there could still be plenty of room to run for Bitcoin, with demand potentially absorbing the LTH profit-taking until the same extreme levels as the past cycles.
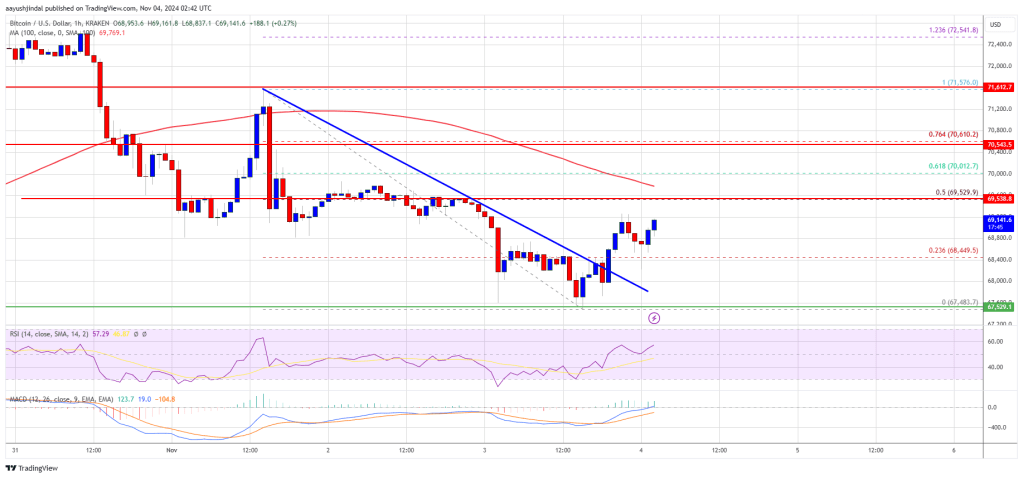
At the time of writing, Bitcoin is trading at around $68,200, up more than 1% over the last 24 hours.

Bitcoin LTH/STH SOPR Ratio Has Crossed Above Its 90-Day MA Recently
In a new post on X, CryptoQuant author Axel Adler Jr has discussed about the recent trend in the Bitcoin SOPR Ratio. The “Spent Output Profit Ratio” (SOPR) is an indicator that tells us about whether the Bitcoin investors as a whole are selling at a profit or loss.
When the value of this metric is greater than 1, it means the average holder is making BTC transactions at a net profit. On the other hand, it being under the mark implies loss-taking is dominant on the network.
The SOPR Ratio, the actual metric of interest here, keeps track of the ratio between the version of the SOPR specifically for short-term holders and that for long-term holders.
Short-term holders (STHs) and long-term holders (LTHs) are the two main divisions of the Bitcoin userbase made on the basis of holding time. The cutoff between these cohorts is 155 days, with investors who hold past this mark moving from the STHs to the LTHs.
Now, here is the chart shared by the analyst that shows the trend in the Bitcoin SOPR Ratio and its 90-day moving average (MA) over the history of the cryptocurrency:

As displayed in the above graph, the Bitcoin SOPR Ratio has seen a surge recently, which suggests the LTHs have been ramping up their profit-taking compared to the STHs.
This trend is something that has historically been witnessed during bullish periods, since the LTHs are resolute entities who tend to amass large profits by the time the bull run hits in full swing.
The STHs are by definition the holders who bought within the past five months, meaning that their cost basis lies somewhere around the prices that BTC was trading at inside this window.
Thus, their profits are never as big as the LTHs, who often have their cost basis close to bear market lows. This is why the ratio blows up toward the LTHs in bullish periods.
With the latest increase, the SOPR Ratio has reached a value of 1.8 and has surpassed its 90-day MA. In the chart, the CryptoQuant author has highlighted the past instances of this crossover. It would appear that this pattern has generally proven to be bullish for Bitcoin.
Naturally, the profit-taking from the LTHs can be a concern, but as is apparent from the graph, the cycle has usually only been at risk of topping out when the ratio has broken above a value of 7.
Thus, there could still be plenty of room to run for Bitcoin, with demand potentially absorbing the LTH profit-taking until the same extreme levels as the past cycles.
BTC Price
At the time of writing, Bitcoin is trading at around $68,200, up more than 1% over the last 24 hours.


