- Bitcoin (BTC) price has remained in a tight range of between $28K and $29K in the past few weeks.
- BTC outperformed the equities market S&P 500, in August.
The popular analytics firm Santiment shared that the trading price of the world’s largest cryptocurrency, Bitcoin (BTC), has remained in a tight range of between $28K and $29K over the past few weeks. Yet, even with this bearish momentum, Bitcoin has outperformed the equities market S&P 500. The trading price of BTC experienced a slight recovery yesterday after reaching the weekly low of $29,088.
In the first half of August, the trading price of Bitcoin held up with a surge of 1.0%, on the other hand, the S&P 500 experienced a decline of 3.3%. Even with the flat momentum, BTC has outperformed the S&P 500. However, the trading price of Bitcoin is still struggling to break its next resistance of $30K.
Bitcoin (BTC) Price Analysis: 24-Hour Timeframe
At the time of writing, bitcoin is trading at $29,168, with a decline of 0.57% in the last 24 hours. However, the trading volume of BTC has experienced an increase of 8.55%, according to CoinMarketCap.

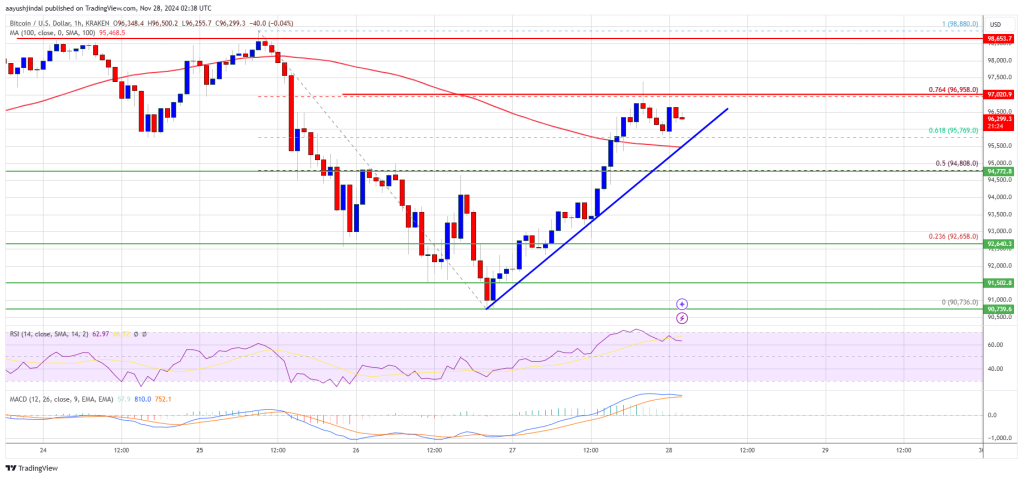
Bitcoin Trading Price Chart (Source: TradingView)
The daily trading price chart shows that BTC is in bearish momentum, as the current price is trading below the 50-day exponential moving average (50 EMA). Moreover, according to the RSI indicator, BTC is in neutral and inching closer to the oversold zone.
According to the data, if Bitcoin experiences bullish momentum, it will reach the nearest resistance of $29,500. If the trend continues, the price will break through the $30,000 mark and even advance to surpass $30,500. On the other hand, another drop may begin if BTC fails to break the nearest resistance of $29,500. Moreover, it will go all the way below the support level at $28,410, and if the bearish momentum continues, BTC will trade below the $28K mark. What do you think, Will BTC show a pump? Tweet to us at @The_NewsCrypto and let us know your thoughts.


