- PEPE’s momentum continues with a 3.42% surge in 24 hours.
- The daily trading volume of PEPE has risen by 223%.
The overall cryptocurrency market recorded a modest 1.70% gain during its latest bullish phase, letting the market cap settle at $2.75 trillion. Recent price patterns of assets demonstrate a bullish shift, as Bitcoin (BTC) and Ethereum (ETH) prices crossed crucial junctures.
Meanwhile, the price movements of the meme coin sector have drawn market attention. Prominent meme coins such as DOGE and Shiba Inu have surged to new highs. Notably, the frog-themed meme coin, PEPE has gained momentum as the crypto market geared up for an altcoin rally.
After a 3.42% gain, the meme coin chose to trade on the upside, pushing past previous resistance points. In the morning hours, the meme coin traded within the $0.00001284 range. PEPE has eventually soared to a high of $0.00001309.
At press time, the meme coin traded at $0.00001205 with a trading volume of $5.07 billion. According to CoinGlass, $7.11 million in PEPE was liquidated during this timeframe.
Zooming in at the weekly price chart, the asset recorded a gain of over 48% and began to trade at $0.000008257. As days progressed, PEPE’s price steadily climbed to the current trading level.
Where Is PEPE’s Next Stronghold?
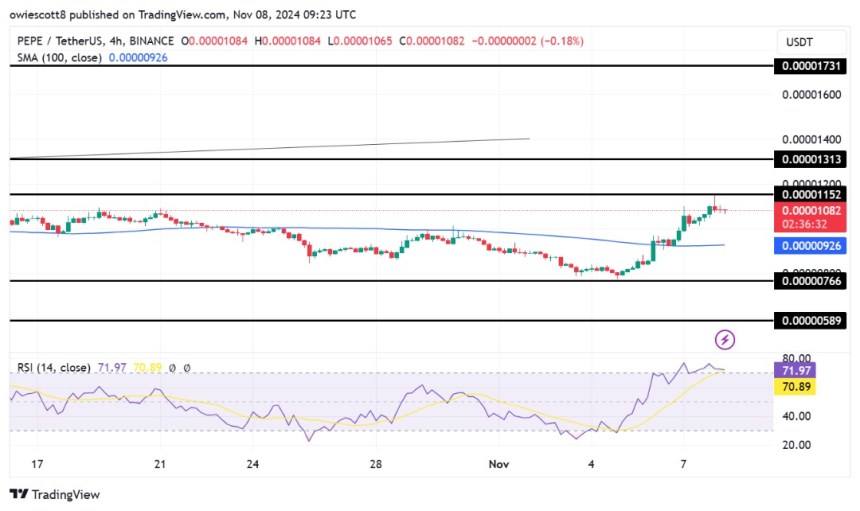
The four-hour price chart of PEPE reveals the probability of an upside correction. The current bullish momentum might have the potential to trigger the meme coin to cross over the current price range. PEPE could likely bring in a retest and might head toward the $0.00001310 range.
On the downside, if the current uptrend of PEPE collapses, bearish pressure appears and it might pull back the meme coin’s price to a low of $0.00001124. The meme coin’s inability to seize the bullish momentum may result in a prolonged downtrend.
Besides, the technical chart analysis of PEPE exhibits ongoing positive momentum. The Moving Average Convergence Divergence (MACD) line is stationed above the signal line, inferring the incoming bull run.
PEPE chart (Source: TradingView)
It’s significant to observe the Chaikin Money Flow (CMF) indicator at 0.11, suggesting the increased money flow. Meanwhile, PEPE’s daily trading volume has surged by over 223%.
PEPE’s current market sentiment might push it into the overbought territory, as the daily relative strength index (RSI) is settled at 65.20. Moreover, the daily frame of the meme coin unveils the short-term 9-day MA above the long-term 21-day MA.
Highlighted Crypto News
Will Ethereum (ETH) Hold the $3K Line or Drop Below?


