Bitcoin (BTC), the leading cryptocurrency in the market, continues to exhibit a stagnant price movement. However, a notable development has emerged as BTC struggles to sustain consolidation above the critical $26,000 threshold. This could potentially present challenges for the cryptocurrency’s performance.
Currently trading at $25,700, Bitcoin is on the cusp of a significant breakout. This breakout can exert pressure on short positions and liquidity pools positioned above or to fill the gaps on lower levels of the Chicago Mercantile Exchange (CME).
What’s more concerning is that these gaps are located near what many experts believe to be the bottom of the Bitcoin bear market.
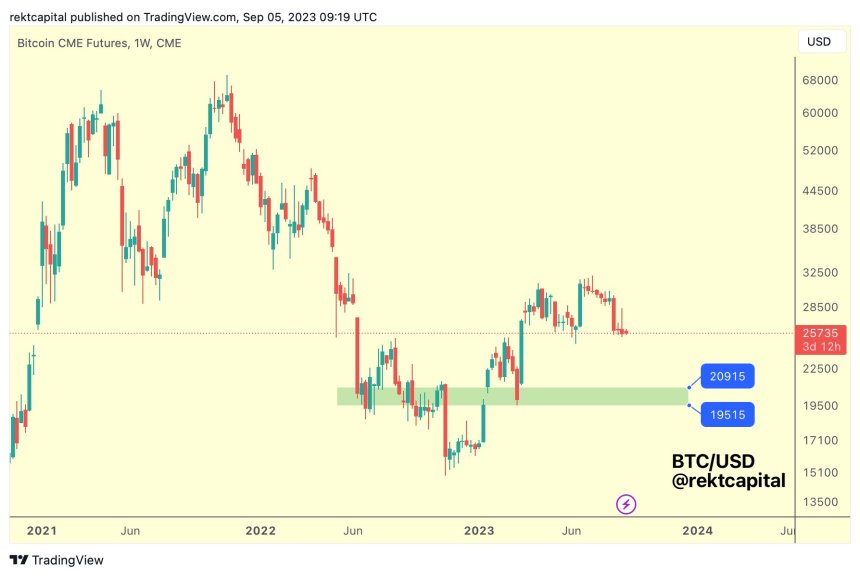
Renowned crypto analyst Rekt Capital has recently shared valuable insights on Bitcoin’s price action and charts, shedding light on the likelihood of the cryptocurrency filling the CME gap at $19,500 and $20,500.
In a YouTube video uploaded on September 5, Rekt Capital emphasizes the significance of BTC’s weekly chart in understanding its recent movements.
According to Rekt Capital’s analysis, Bitcoin’s weekly chart reveals a double top formation at $30,800, a pattern historically followed by symmetrical downside movements. Drawing from this observation, Rekt Capital suggests that the current price action could potentially open the doors to filling the CME gap at $19,500 in the short term.

Another factor highlighted by Rekt Capital is the importance of the $26,000 support level, which Bitcoin is currently losing.
The analyst suggests this loss could further extend BTC’s downside price action, bringing it closer to the CME gap. Adding to the concern, Rekt Capital points out a bearish fractal published on August 30, in which Bitcoin’s weekly chart indicates a lower high, signaling a continuation of the downtrend.
In the event of a revisit to the sub $20,000 level, Rekt Capital notes the possibility of a head and shoulders pattern forming on BTC’s weekly chart. While the right shoulder of the pattern is yet to be completed, the overall structures indicate that the pattern could eventually be fulfilled.
Rekt Capital’s analysis underscores the significance of BTC’s current price action and charts, highlighting potential scenarios such as filling the lower CME gap and navigating the obstacle presented by the already filled gap at $28,000.
The outcome of these scenarios for the dominant cryptocurrency in the market is yet to be determined. However, what is evident is the prevailing bearish sentiment that has gripped the Bitcoin market, instilling apprehension among investors.
BTC has experienced a 0.8% decline over the past 24 hours and a 7.8% decrease over the seven days, with its current trading price falling below the $25,800 mark.

Featured image from iStock, chart from TradingView.com
Currently trading at $25,700, Bitcoin is on the cusp of a significant breakout. This breakout can exert pressure on short positions and liquidity pools positioned above or to fill the gaps on lower levels of the Chicago Mercantile Exchange (CME).
What’s more concerning is that these gaps are located near what many experts believe to be the bottom of the Bitcoin bear market.
Bitcoin Double Top Formation And Implications For Price
Renowned crypto analyst Rekt Capital has recently shared valuable insights on Bitcoin’s price action and charts, shedding light on the likelihood of the cryptocurrency filling the CME gap at $19,500 and $20,500.
In a YouTube video uploaded on September 5, Rekt Capital emphasizes the significance of BTC’s weekly chart in understanding its recent movements.
According to Rekt Capital’s analysis, Bitcoin’s weekly chart reveals a double top formation at $30,800, a pattern historically followed by symmetrical downside movements. Drawing from this observation, Rekt Capital suggests that the current price action could potentially open the doors to filling the CME gap at $19,500 in the short term.

Another factor highlighted by Rekt Capital is the importance of the $26,000 support level, which Bitcoin is currently losing.
The analyst suggests this loss could further extend BTC’s downside price action, bringing it closer to the CME gap. Adding to the concern, Rekt Capital points out a bearish fractal published on August 30, in which Bitcoin’s weekly chart indicates a lower high, signaling a continuation of the downtrend.
In the event of a revisit to the sub $20,000 level, Rekt Capital notes the possibility of a head and shoulders pattern forming on BTC’s weekly chart. While the right shoulder of the pattern is yet to be completed, the overall structures indicate that the pattern could eventually be fulfilled.
Rekt Capital’s analysis underscores the significance of BTC’s current price action and charts, highlighting potential scenarios such as filling the lower CME gap and navigating the obstacle presented by the already filled gap at $28,000.
The outcome of these scenarios for the dominant cryptocurrency in the market is yet to be determined. However, what is evident is the prevailing bearish sentiment that has gripped the Bitcoin market, instilling apprehension among investors.
BTC has experienced a 0.8% decline over the past 24 hours and a 7.8% decrease over the seven days, with its current trading price falling below the $25,800 mark.
Featured image from iStock, chart from TradingView.com


