- Solana faces strong resistance with high liquidation risk at $246
- Chaikin Money Flow indicates increasing selling pressure
- Technical analysis suggests potential drop to $222-$200 range
Solana (SOL) has encountered significant headwinds in its attempt to reach new historic highs, with the price consolidating around $238. A comprehensive analysis of multiple technical indicators suggests that the cryptocurrency might face additional downward pressure in the near term.
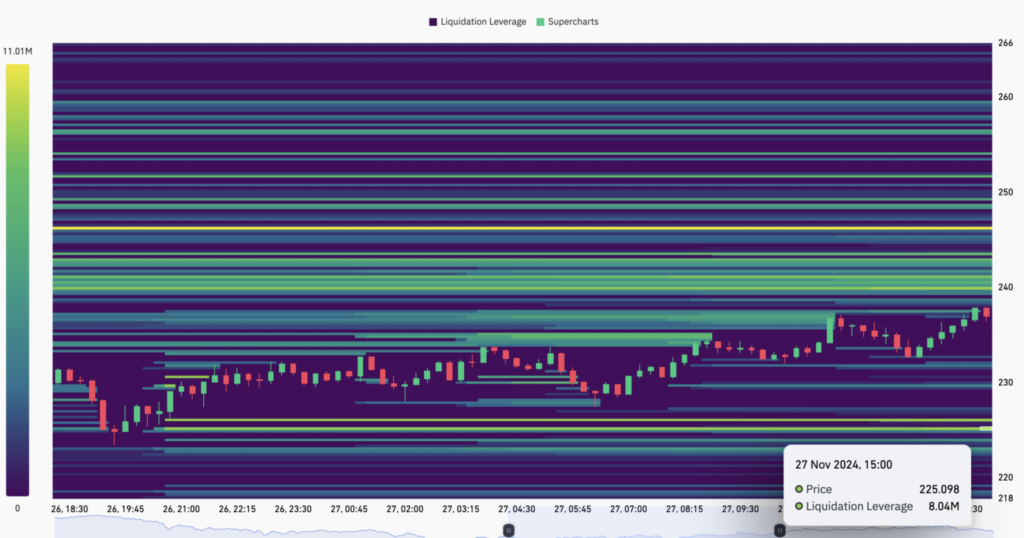
The liquidation heatmap, a sophisticated tool for understanding potential price movements, reveals critical price levels that could influence SOL’s trajectory. This indicator currently shows a high concentration of liquidity at two key levels: resistance at $246 and support at $225.

Source: Coinglass
The heatmap’s color gradient, shifting from purple to yellow in these regions, signals significant order book activity. With current trading volumes remaining subdued, these levels become particularly significant as potential price targets.
Solana CMF enters downward trend
Adding to the bearish outlook, the Chaikin Money Flow (CMF) metric has entered a concerning downward trend. This technical indicator, which measures the flow of capital in and out of an asset, suggests that selling pressure is mounting. The declining CMF reading typically precedes price decreases as it reflects diminishing buying interest and increasing capital outflows from the market.
Perhaps most tellingly, Solana’s Balance of Power (BoP) indicator has moved into negative territory on the daily timeframe. This transition is particularly significant because the BoP directly compares bullish and bearish market forces. Its current negative reading suggests that sellers have gained the upper hand in the ongoing price battle.
Looking at potential price targets, the Fibonacci retracement levels provide a framework for possible support zones. Should the current bearish pressure persist, SOL could test the 23.6% retracement level near $222.
In a more severe scenario, the price might extend its decline toward the psychologically important $200 level. However, a revival in buying interest could still invalidate this bearish outlook, potentially pushing SOL toward $265.
The convergence of these technical signals suggests that investors should carefully monitor these key levels, particularly the crucial $225 support, as they may determine SOL’s next significant move.


